Improve your email response rate with RFM analysis
If you're a marketing professional, you might already know that sending lots of emails doesn’t necessarily lead to a higher response rate. Email marketing typically needs to be highly targeted and personalized. That being said, creating a warm, personalized email for each lead is a laborious process and it may yield very low ROI on your time and efforts.
In this article, we’ll talk about a more efficient way for cold email campaigns. Through segmenting your leads into different groups, you can create more personalized email campaigns for specific audiences. This will involve a process called RFM analysis, it’s a great method for customer segmentation.
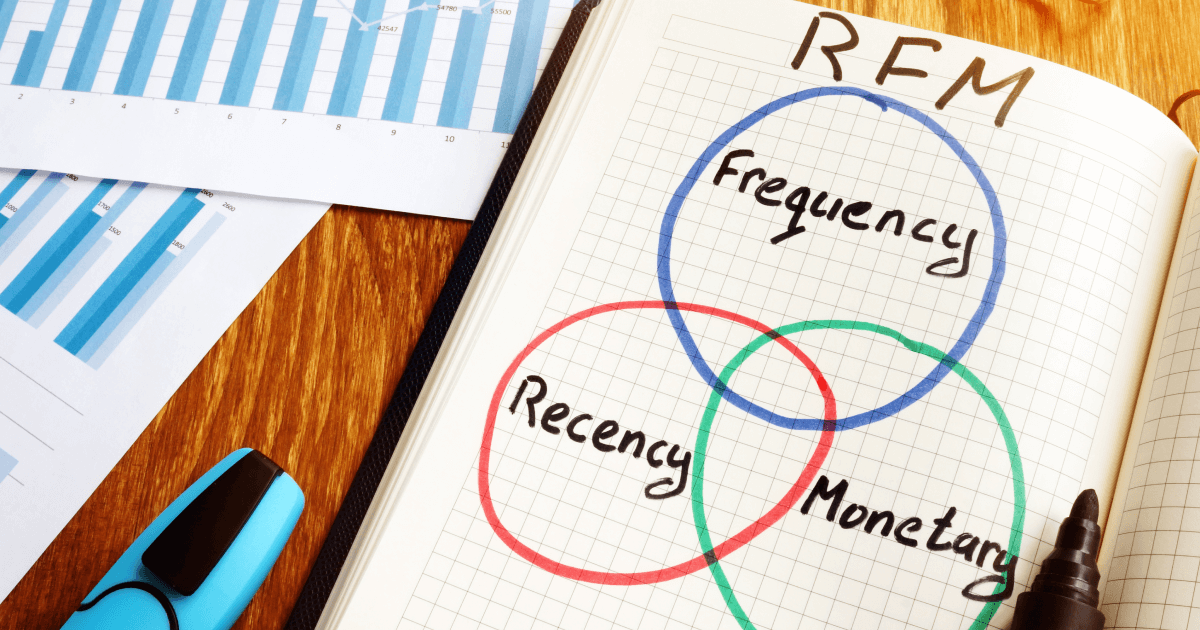
What is RFM analysis?
RFM analysis is a common framework for customer segmentation. The term represents three metrics respectively: Recency, Frequency, and Monetary. These metrics measure different aspects of buying behavior and convert qualitative behavior into quantitative scores. This way you can compare different customer’s behavior and segment them into different groups.
Recency
When the customer recently placed an order, you can get a recency metric by counting the number of days since the customer last made the purchase. Generally, customers who have made a purchase recently are more likely to reply or interact with your email.
Frequency
How many orders did the customer place over a period of time? Customers with high purchase frequency are of course more likely to come back to your store again.
Monetary
How much money have your customers spent on purchases? Customers who spend more money in your store are also more willing to spend more.
How RFM analysis can improve your email campaign?
Prioritize the high-value customers
RFM scores give you some indicators to determine how important a customer is and decide how to allocate your marketing resources. Generally, you should focus more on customers with high recency, frequency, and monetary, instead of spending too much time on those one-time customers.
Customize your campaign based on value instead of volume
Customers with similar purchasing habits may have similar needs. You can segment your customers based on their RFM scores and customize marketing content for different groups, instead of sending the same content to all customers. By analyzing their behavior pattern, you can give them appropriate offers or discounts to appeal to them.
Track the change of customer behavior
RFM analysis can help you evaluate the changes in your customer’s behavior. For instance, try to answer these questions for your email campaign. Have your customers come back to your store recently? Did they visit more or spend more at a time in your store? Is there any change in behaviors that can imply the effectiveness of previous marketing campaigns? If some answers are obscure, try designing some A/B tests to help you assess performances.
How to Perform RFM analysis?
Before starting any calculation, you should prepare a dataset about your customers’ order history. This dataset should include the following information:
- Who made this order?
- When did the order happen?
- How much did the customer spend on this order?
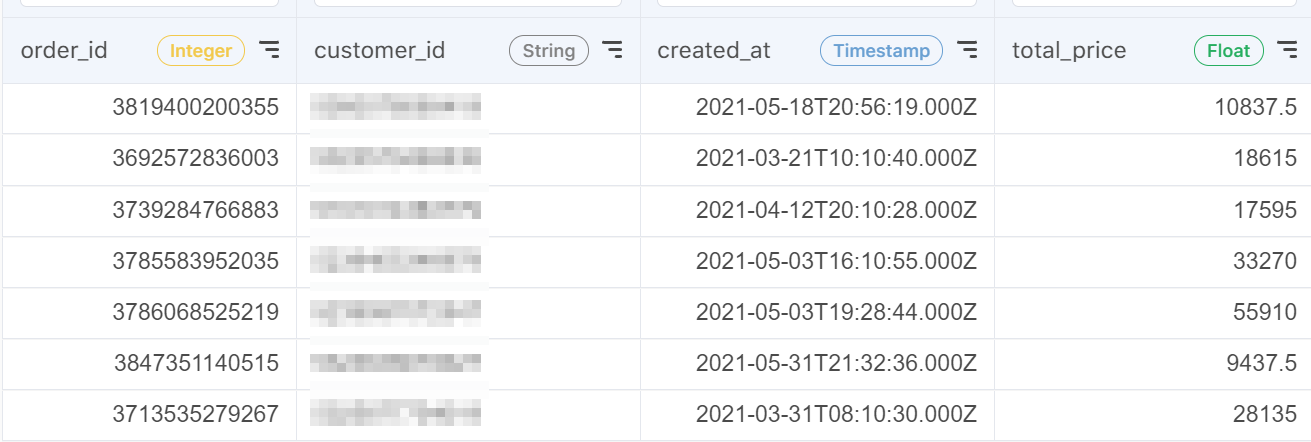
Take Shopify as an example. If you are operating your store on Shopify, you can get all order data including order_id, customer_id, created_time, and totol_price. Once you have this necessary information, you can follow the following steps to calculate RFM scores.
Step 1. Calculate RFM scores
RFM scores focus on quantifying individual purchasing behavior. The idea is to extract every customer’s purchase history and transform it into numbers.
Suppose you have a table that includes John’s purchase history.
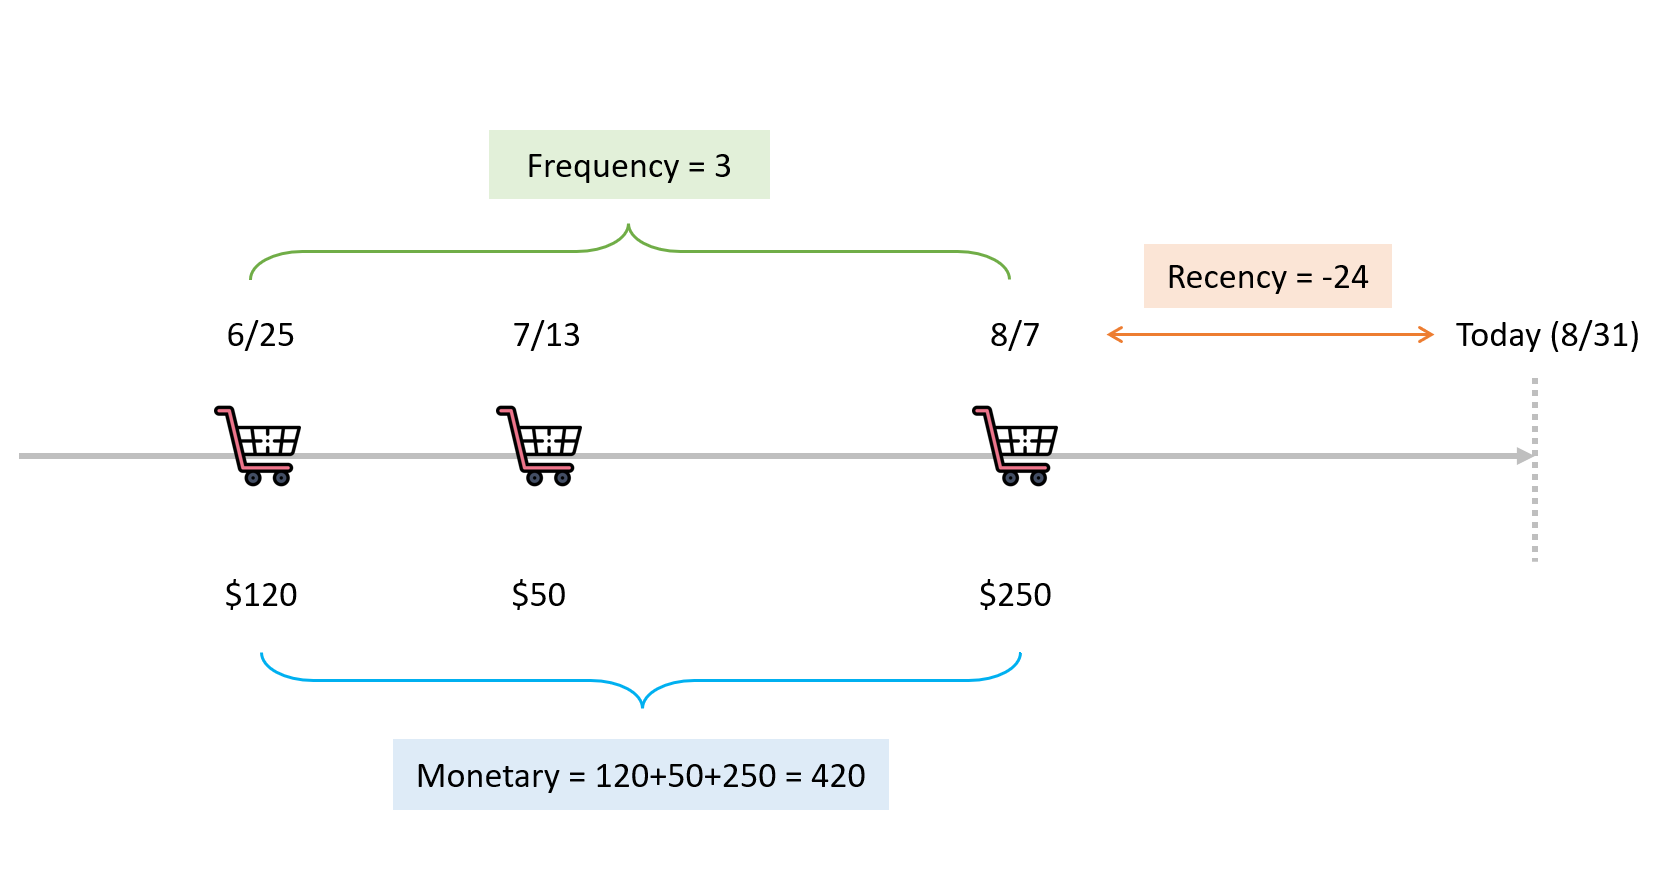
Now, let’s dive into each metric for John.
Recency:
The last time John made a purchase was 2021/08/20. If today is 2021/08/31, the recency score is 11 days, which is the number of days between 2021-08-21 and 2021-08-31.
Frequency:
The customer made three purchases in total, so the Frequency score is 3.
Monetary:
The Monetary score is the summation of the total amount of price in these three orders, so the score is 120+50+250 = 420.
To make it clear, we can visualize the entire calculation.
It is easy to calculate the RFM scores for a single customer. However, it is unrealistic to calculate the RFM scores for thousands of customers separately. How can we scale the calculation?
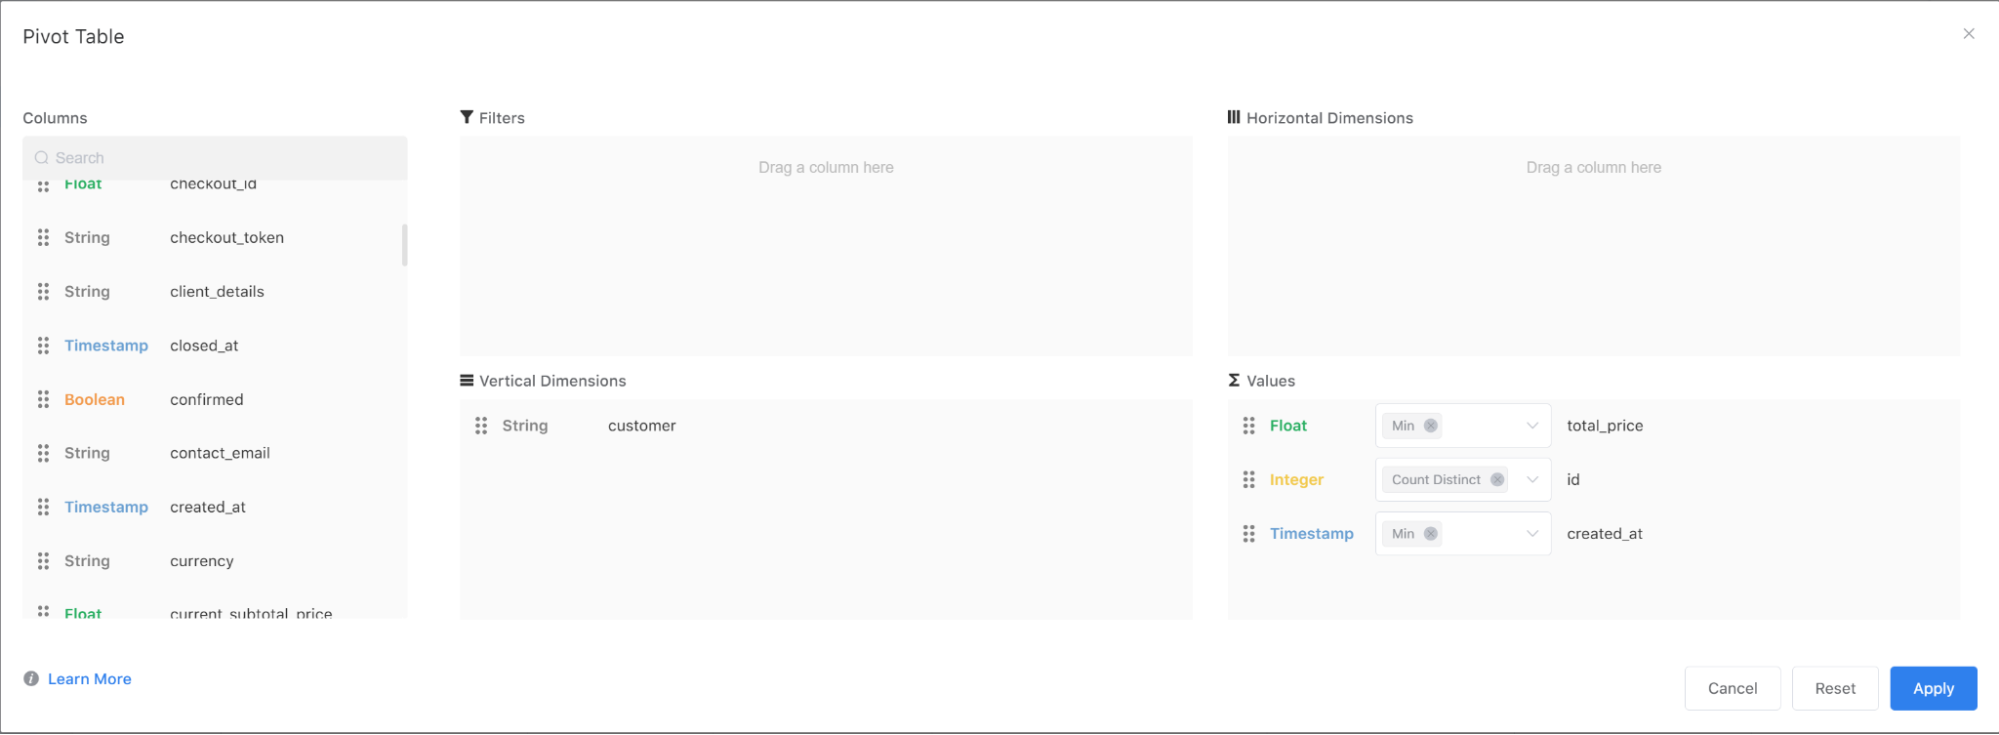
One way to do so is to create a Pivot Table. Pivot tables are one kind of technique to create a different view of the table by aggregating data based on a specific column. Lots of tools, such as Excel or Acho Studio, support features like Pivot Tables.
Take Acho Studio as an example. You can simply use the built-in Pivot Table action for this.
If your data is stored in a relational database, you can write SQL queries to run the analysis. In SQL, you can use GROUP BY statement and aggregation functions to compute these scores.
Step 2: Convert RFM scores to categories
After calculating RFM scores, the next step is to convert these scores into several groups based on some benchmarks. One of the ways to determine the benchmark is to use percentiles. Percentiles indicate the percentage of scores that fall below a particular value. For example, if the value of the 25th percentile for the monetary score is 500, it means that there are 25% of the values below 500.
Percentiles can help you distribute values into several groups approximately evenly. Generally, you can choose to split each metric into 3 to 5 groups. Suppose you want to split the monetary score into three levels. Here is how you can categorize the monetary scores.
- Level 1: monetary score < the 33rd percentile
- Level 2: monetary score between the 33rd percentile and 67th percentile
- Level 3: monetary score > the 67th percentile
In this example, each level has around 33% of customers.
On Acho, you can calculate the percentiles using PERCENTILE_CONT() OVER() in Formula.
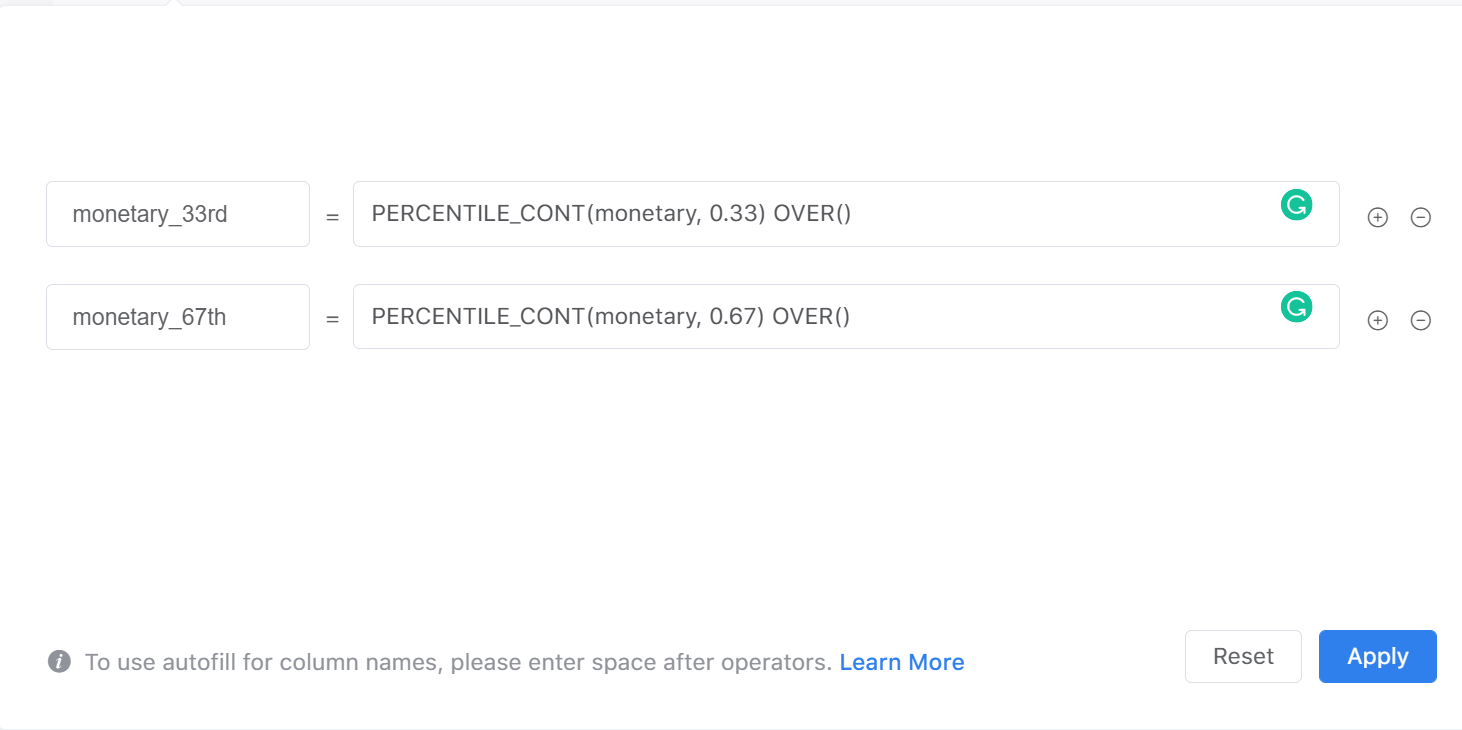
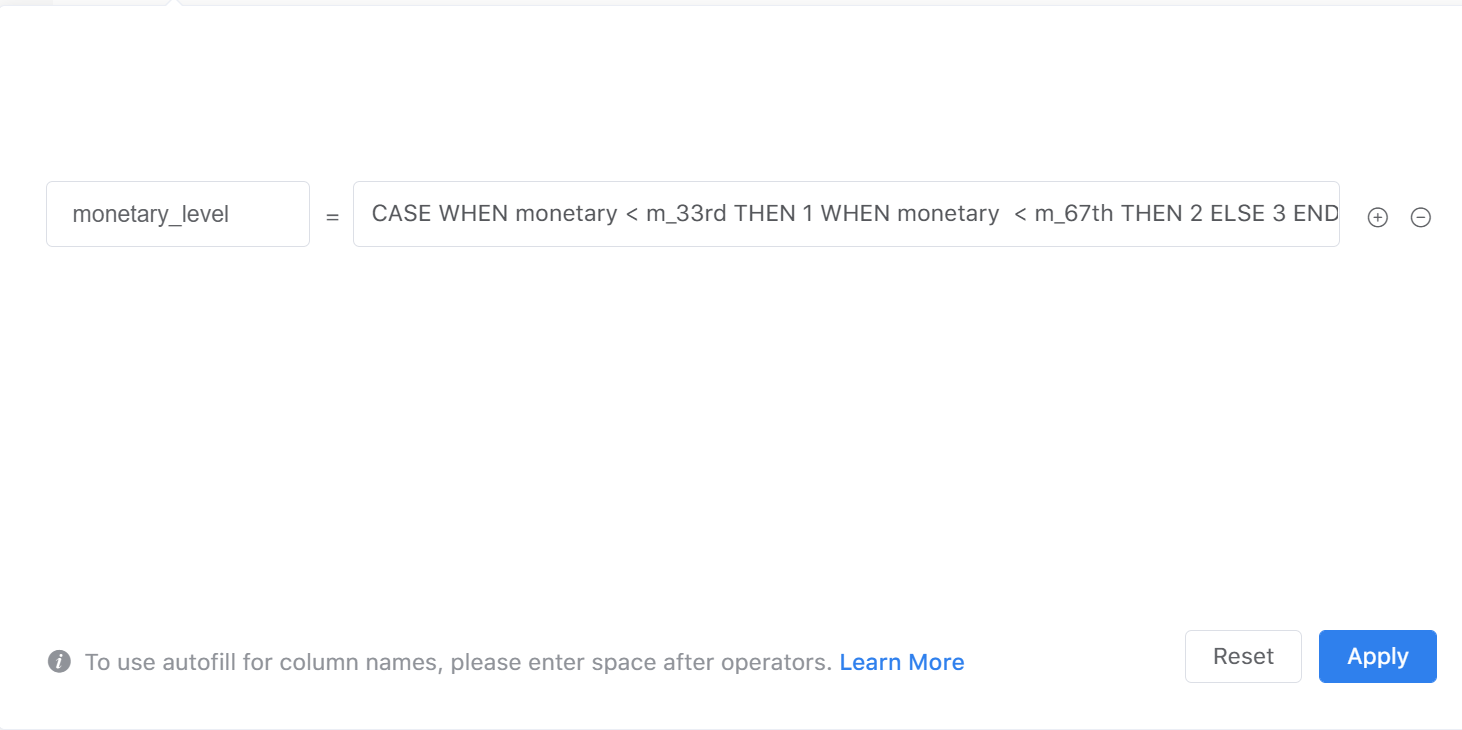
Then, apply CASE statements to convert the monetary scores into three different levels based on the 33rd percentile and the 67 percentile.
If you apply the same method to the recency and frequency scores, here is what your resulting table should look like:
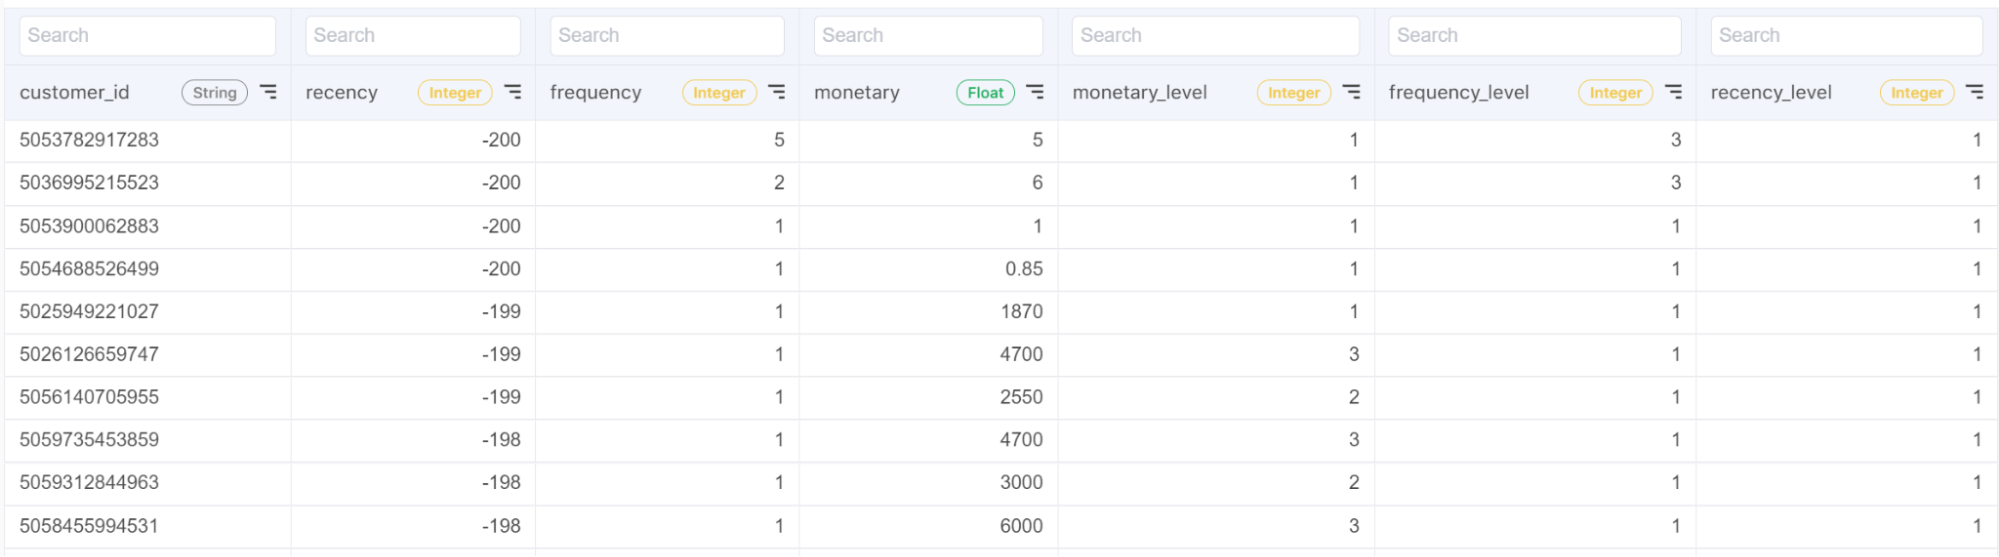
As you can see, each customer will have a monetary level, frequency level, and recency level, respectively. For each indicator, the highest level is 3, the lowest level is 1.
Step 3: Design marketing campaign based on RFM analysis
Now, you can start to categorize customers based on their behavior and design appropriate campaigns for them. Generally, customers who have high recency are more likely to interact with your emails. They may be your new customers or active customers, so they make purchases recently. They should be the tier1 customers that you should spend more time with.
Here is an example of how you can categorize your customers.
Tier 1:
- Recency = 3, Frequency = 3, Monetary = 3
These customers are your most valuable customers. They are highly loyal to your brand and are willing to contribute their time and money to your products. Keep interacting with these customers and treat them as VIP customers to maintain a good relationship with them. - Recency = 3, Frequency >= 2
They are promising customers and probably become VIPs in the future. - Recency = 3, Frequency = 1
These customers are new to your store. Make efforts to convert them into loyal customers.
Tier 2:
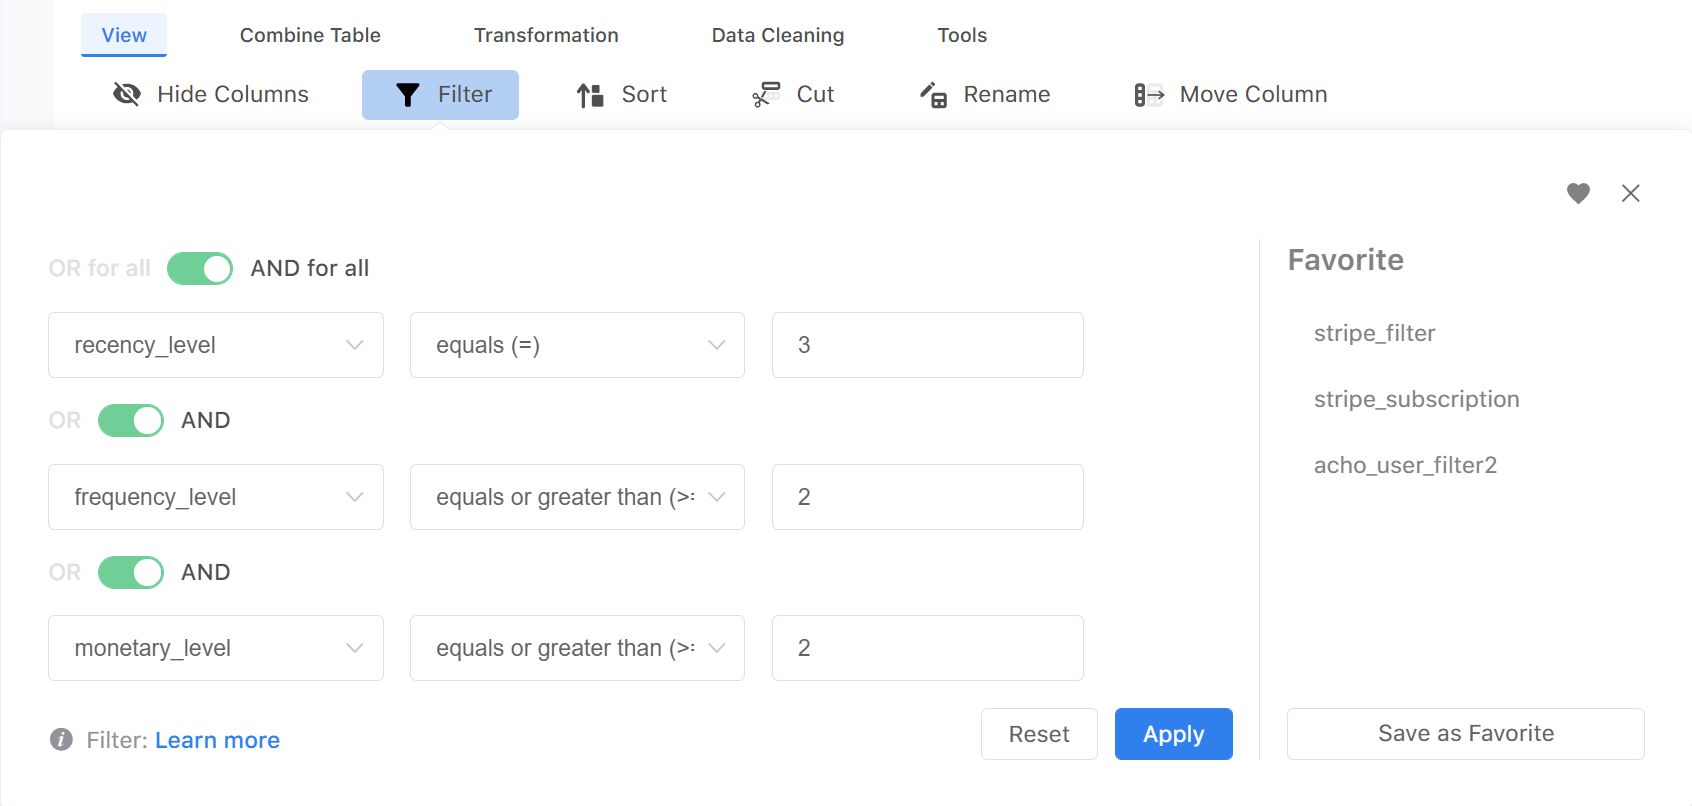
- Recency <= 2, Frequency >= 2 or Monetary >= 2
These customers were active in the past but are inactive recently.
Tier 3:
- Low recency, Low frequency, and Low monetary:
Basically, these customers lose interest in you, so don’t spend too much time on this group.
Now, you can filter your customers based on these criteria and design customized marketing content for different groups.
Automate RFM analysis every month
Once you have built up a pipeline for the RFM analysis, you can automate the entire process on Acho. That is, you can get a new customer list for your email campaigns every month by clicking Request Sync Now or setting up schedulers to update data at a certain time.
Conclusion
There are several methods to do customer segmentation and RFM analysis is just one of the methods. RFM analysis only considers buying behavior and doesn’t consider other characteristics for a customer, such as genders, ages, regions, and so on. If you want to generate more customized emails, you can use other features to generate more customer groups and make the emails likely to address their needs.