Business data is growing rapidly as consumer digital footprints grow. As one can imagine, there are more and more connected devices logging our data both online and offline. As businesses receive more of this data, they now can understand their customers better than ever before. One critical area of this process to understanding customers is augmenting analytics with not only internal data customers incur but also external data from third-party sources.
What is External Data?
1. Publicly Available Data (Open Data)
Publicly Available Data, as the name suggests, is data provided to the general public for free, including but not limited to subjects such as
- Weather Data
- Traffic Data
- Legal Compliance Data
- Economic Data
- Scientific Data
- Market Data
- Public Health Data
Data on these subjects are great for analytics as they typically offer a large number of records with a lot of attributes. However, associating them with internal data requires data cleaning and domain knowledge in certain subjects. Nevertheless, utilizing them correctly can add a lot of value to a good business dataset. Examples such as predicating parcel delivery time based on weather and traffic data, understanding competitive offerings based on market data, and analyzing consumer trends based on economic data, can all augment existing business data.
Good join keys for connecting internal and external data are typically locations, timestamps, or other public identifiers such as IP filing code, housing permit code, and financial instrument code (ISIN, CUSIP).
2. Shared Data Within an Organization
Shared Data within an Org is perhaps the most common method for augmenting one existing data source. For organizations that operate with multiple production systems across functions in Sales, Marketing, Project Management, Finance and Accounting, and other departments, bringing data together can be valuable for improving one existing function.
For example, the Sales team can request data from the Marketing department so customer needs, behaviors, and intents can be better understood for an improved sales process.
3. Commercial Data from Vendors
Many data products can be purchased through commercial vendors. A good example would be financial market data from the stock exchanges or research companies. These data products typically meet an industry standard for being comprehensive, accurate, and timely. Hence, these data products can carry a lot of value for enhancing your existing data.
Additionally, many data providers would typically agree to customize their products to a certain extent so they can fit your requirements. This means a higher probability of these external data enhancing your existing internal data.
How to augment your internal data with external data?
Augmenting analytics with external data is a multi-faceted topic. Rarely, a company relies on one specific method for enhancing its analytics. More often than not, these methods are exploratory and experimental.
Here is a great example of how a retail company can use external data to understand its business better.
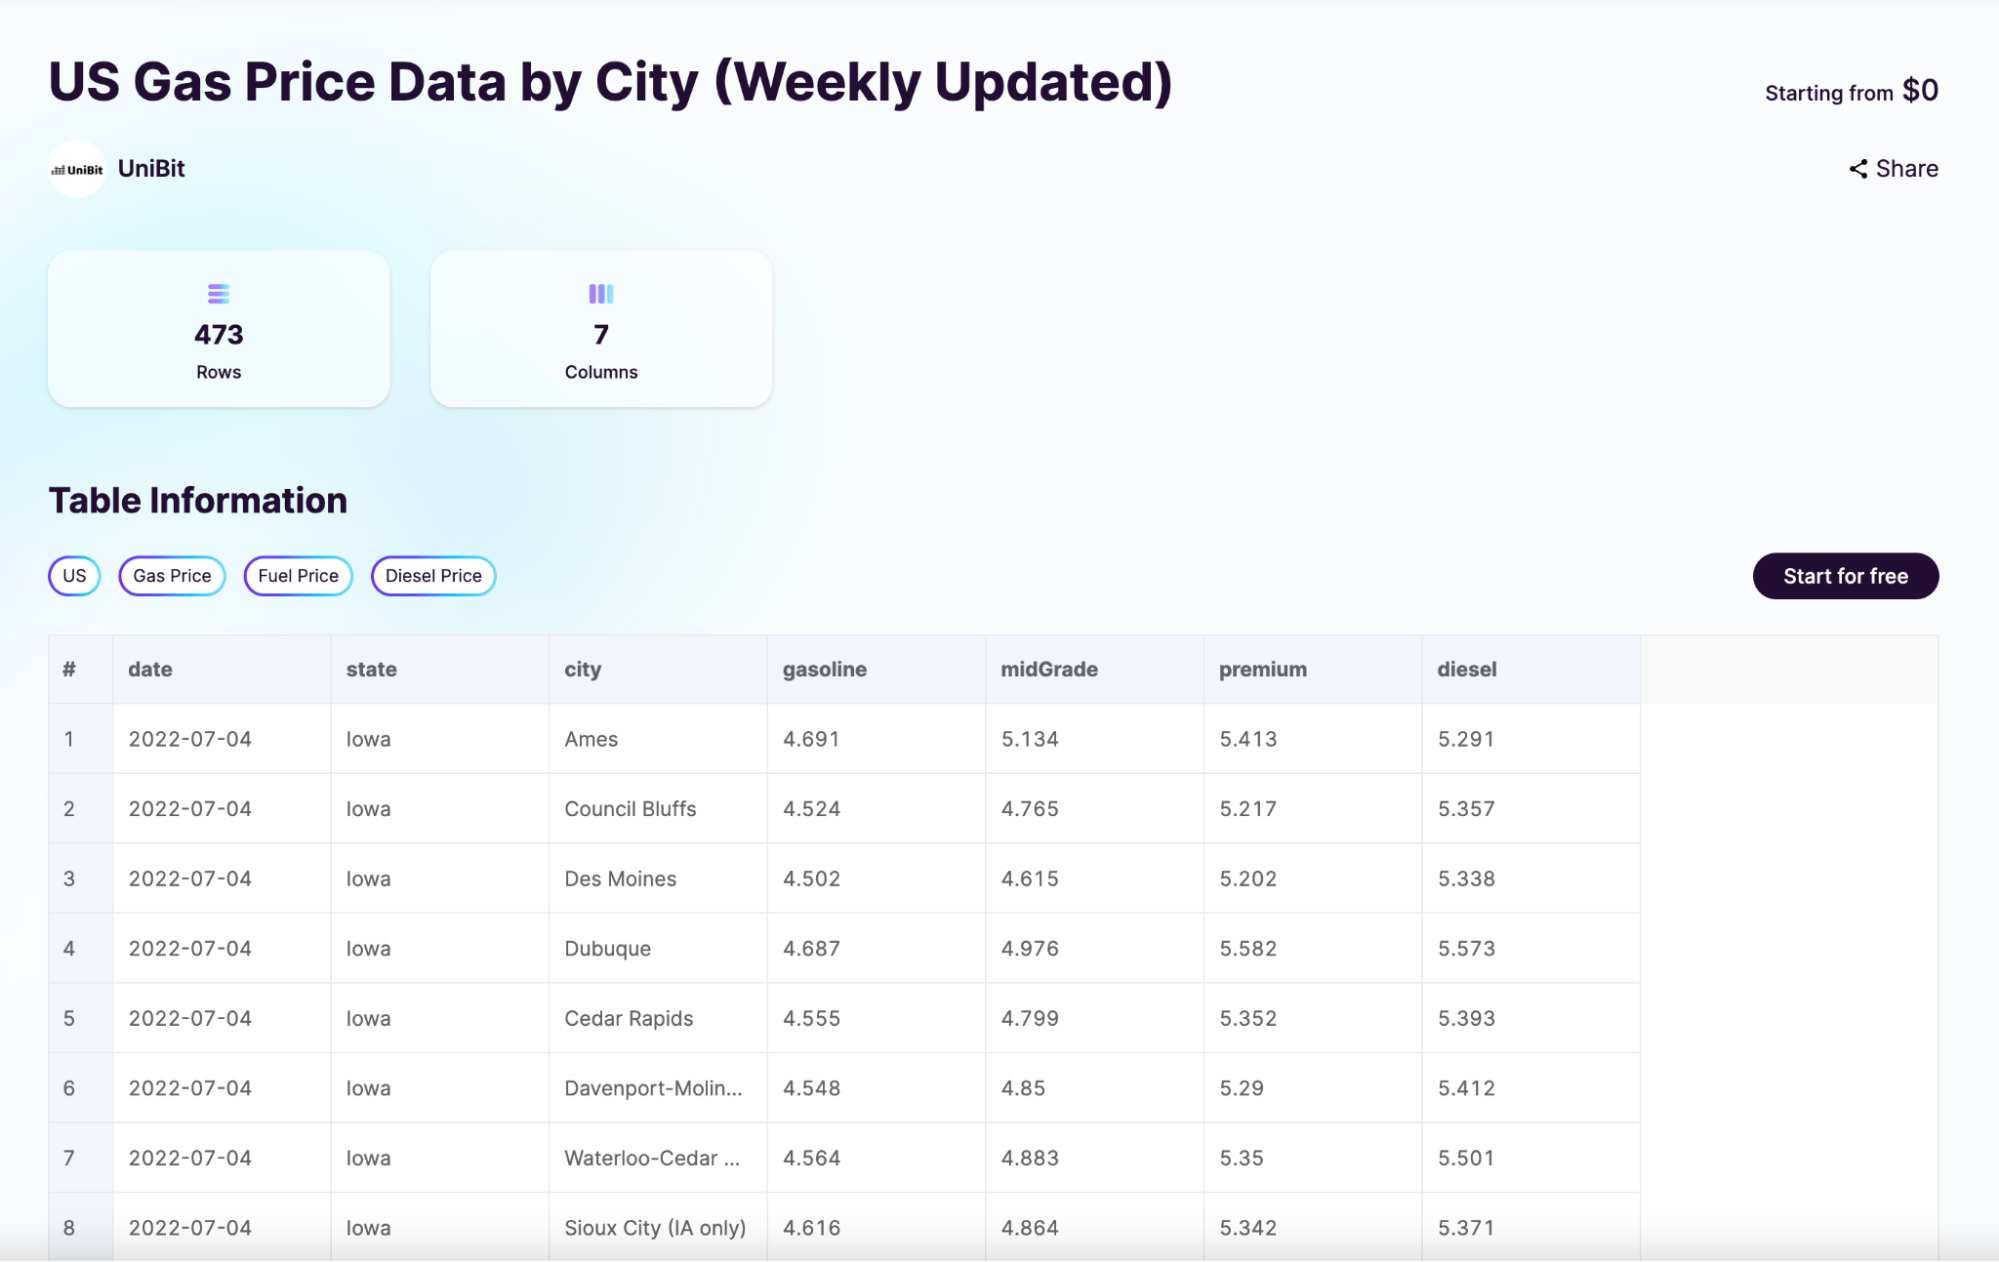
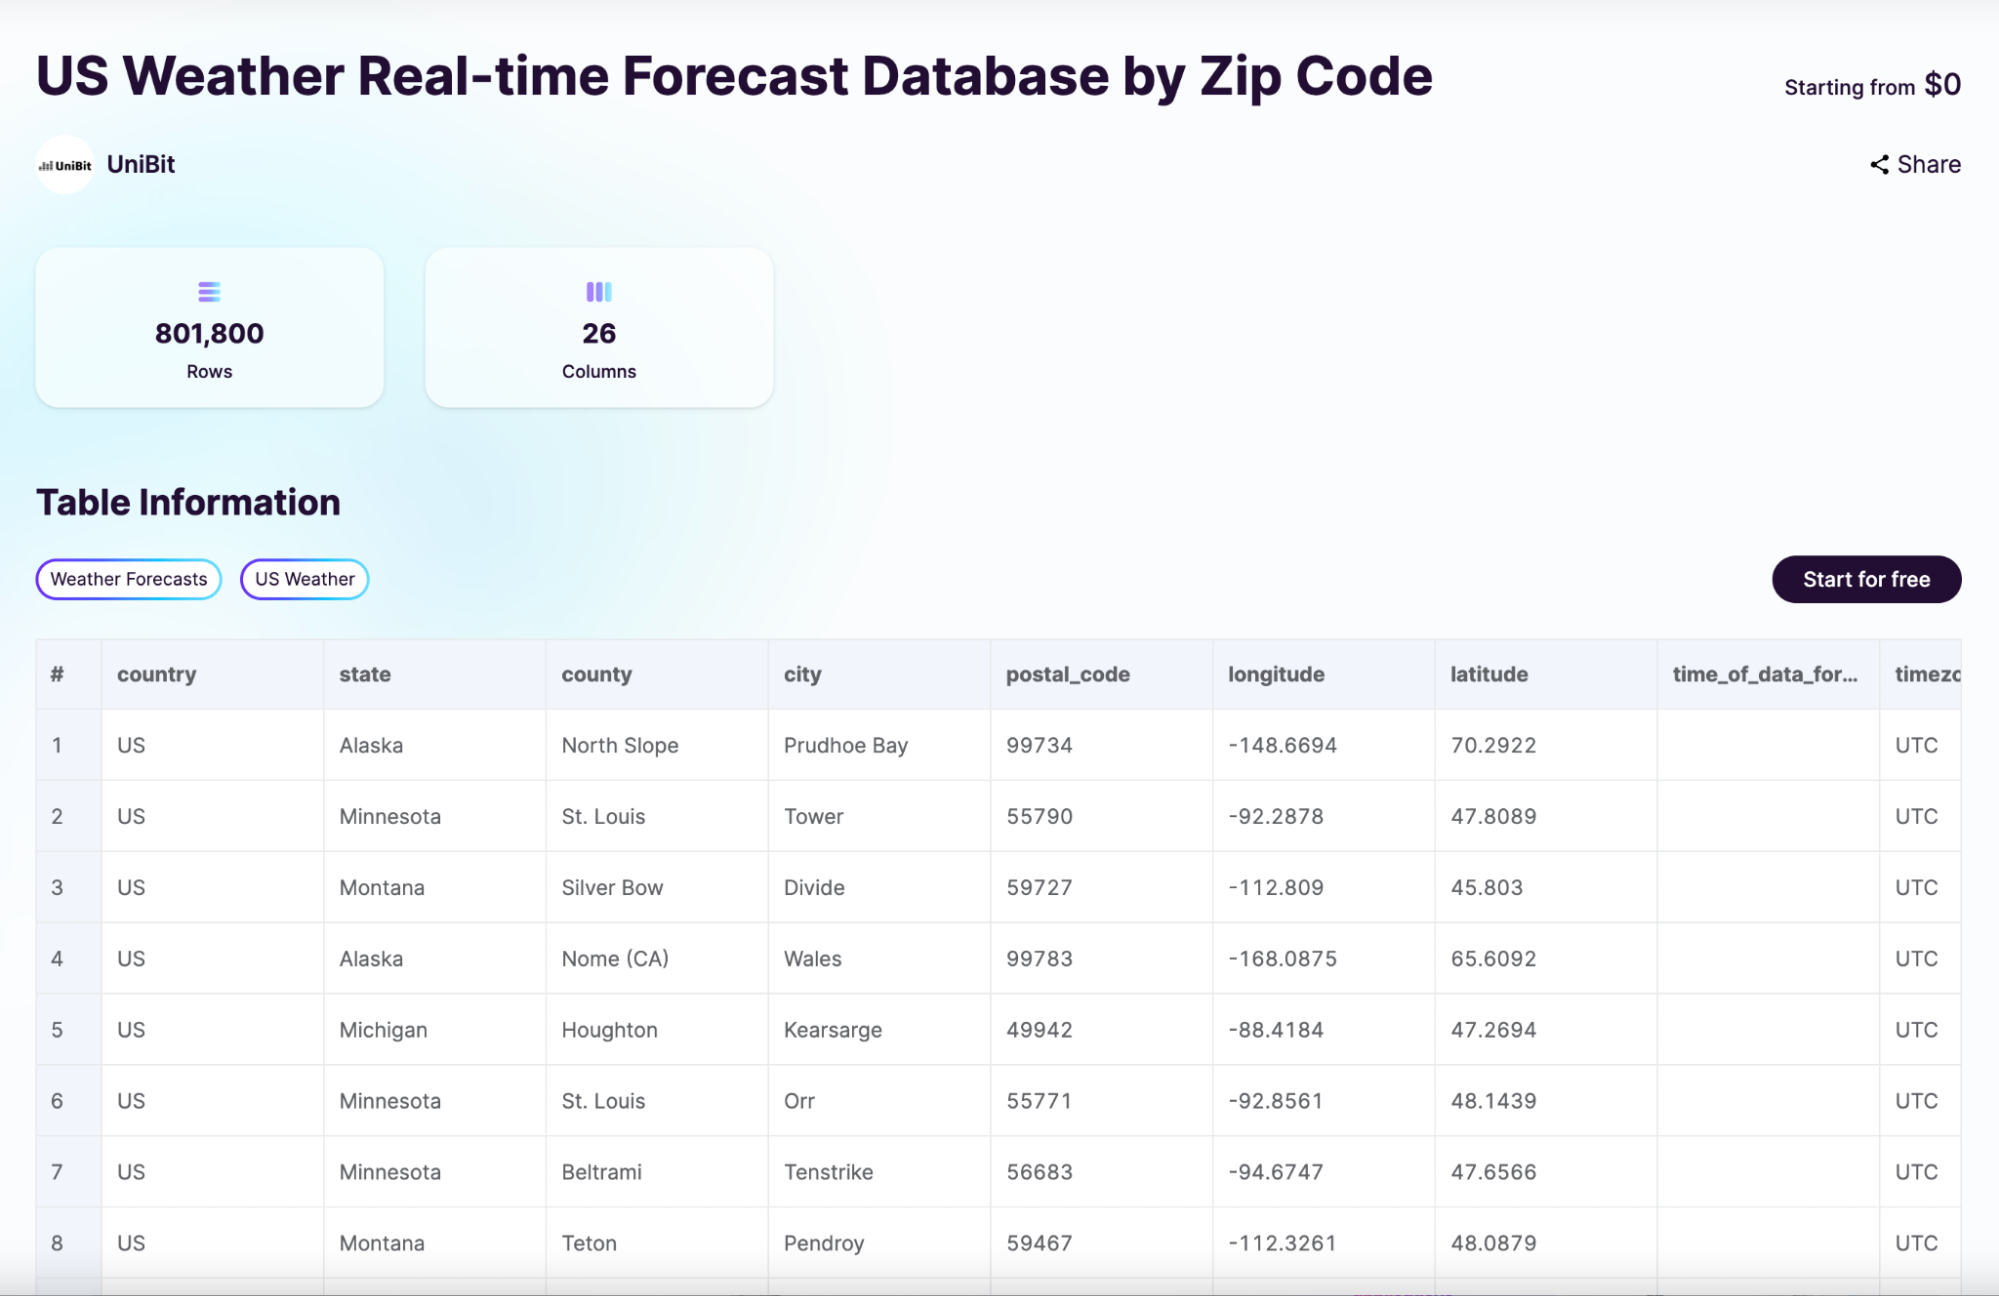
1. Discover external data in a data marketplace
For discovering interesting external data, you can visit https://marketplace.acho.io/store. This marketplace continuously publishes new data products that can potentially improve business performances.
This particular dataset contains US Gas Prices for every city and it’s updated every week. Another dataset is real-time weather data categorized by city.
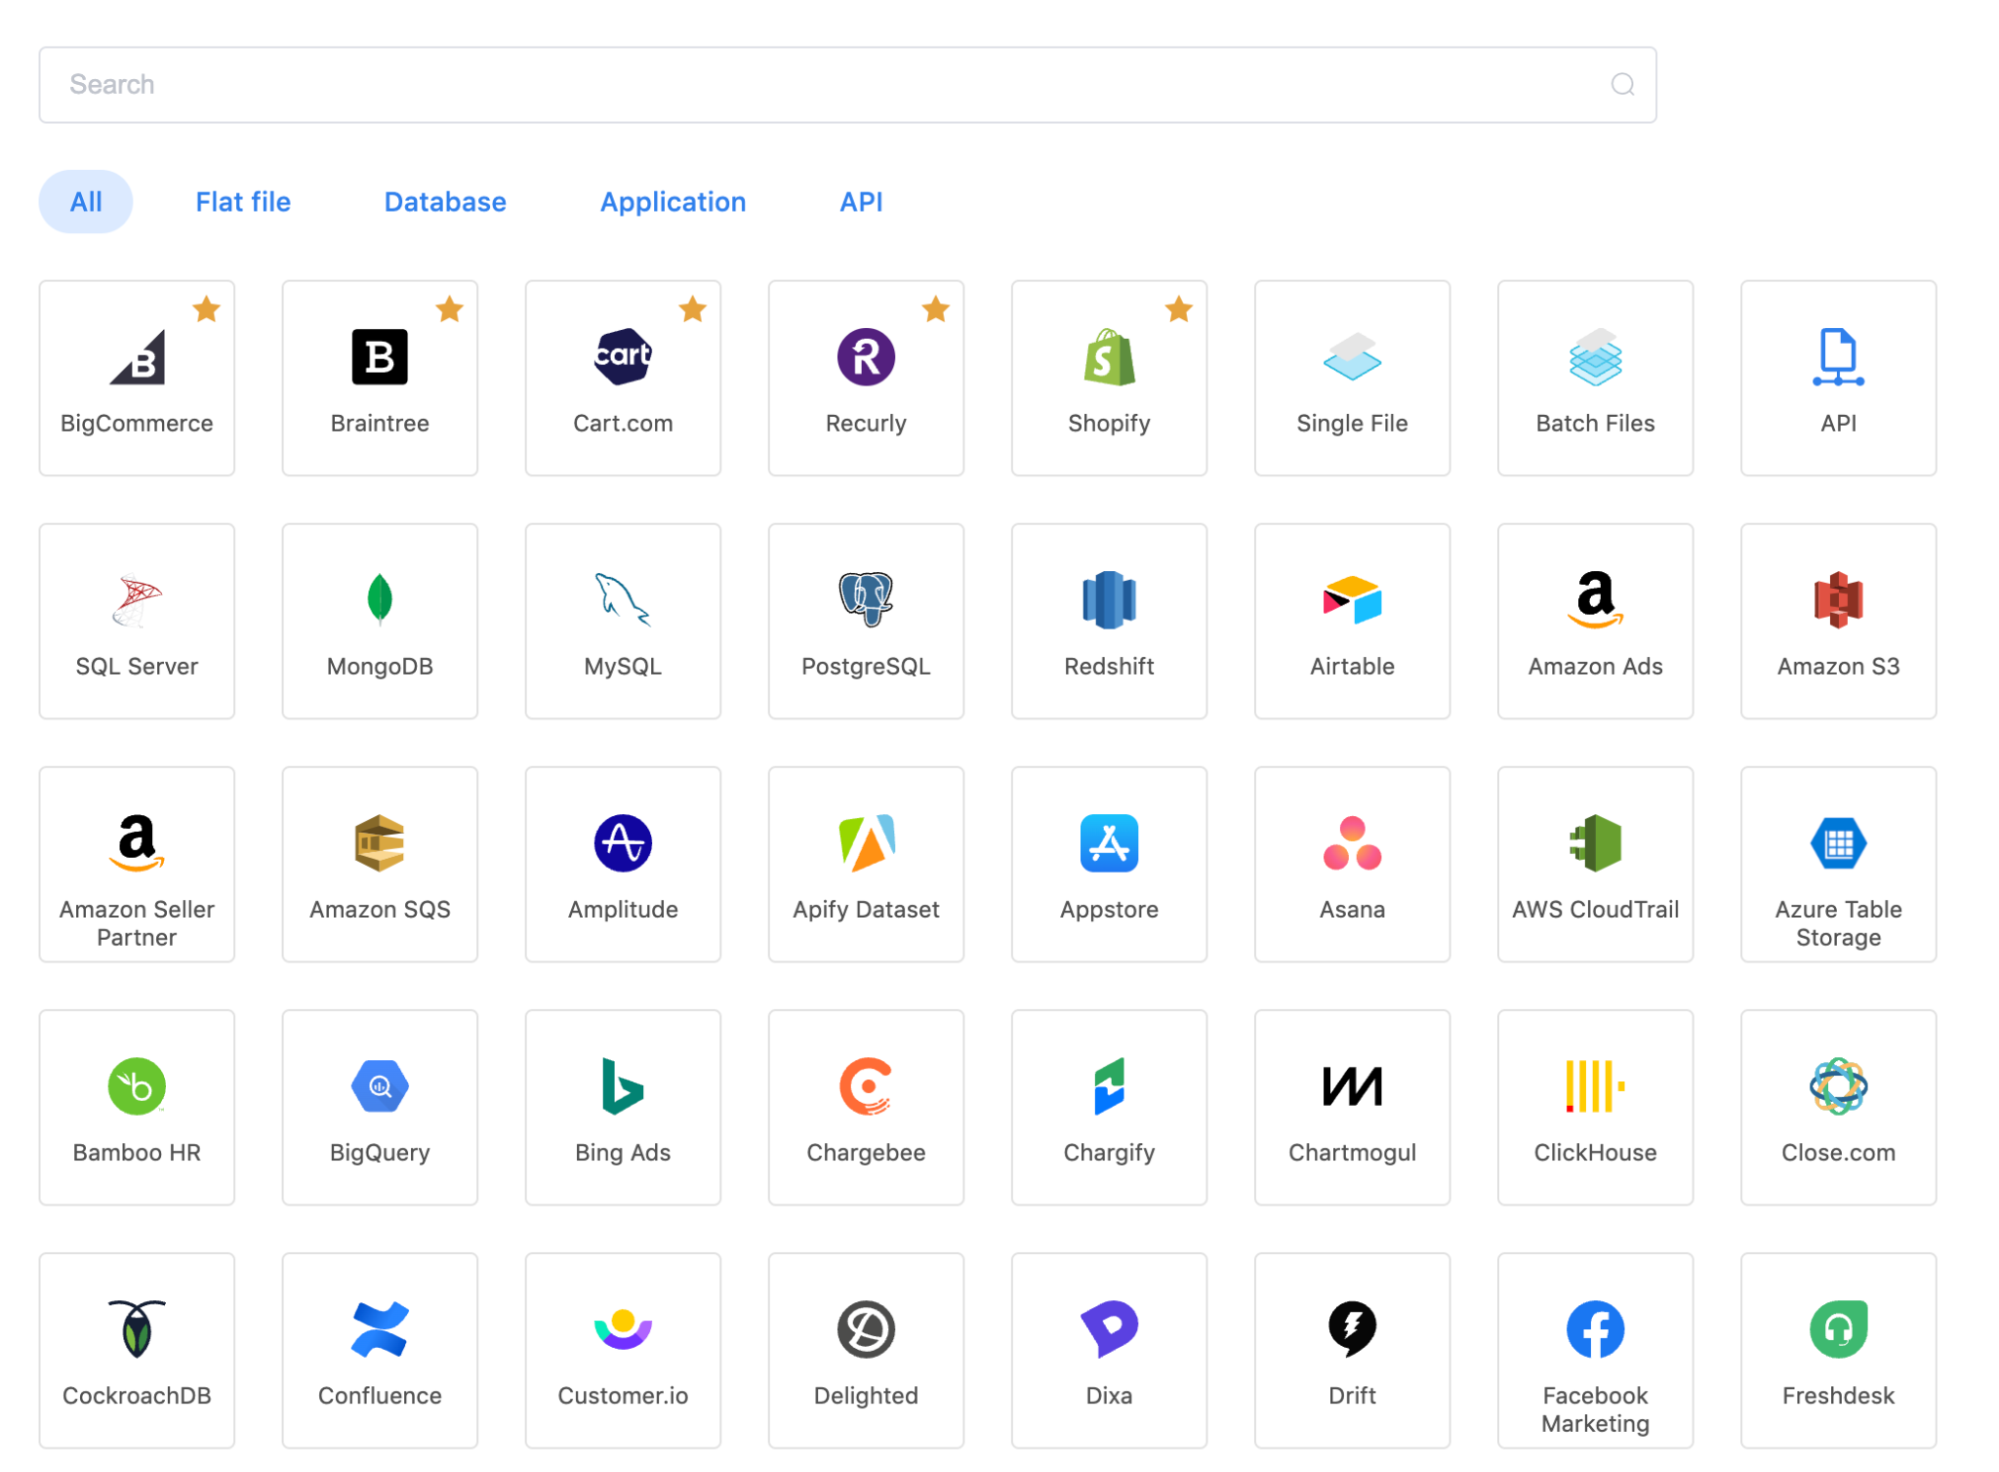
2. Connect Internal Data with an OLAP
Once you’ve subscribed to the external data on the marketplace, you should now connect your internal data. Acho has a whole suite of pre-built data connectors for flat files, APIs, apps, and databases. Once you have verified your credentials, a data connection can be set up automatically for your analytics later on.
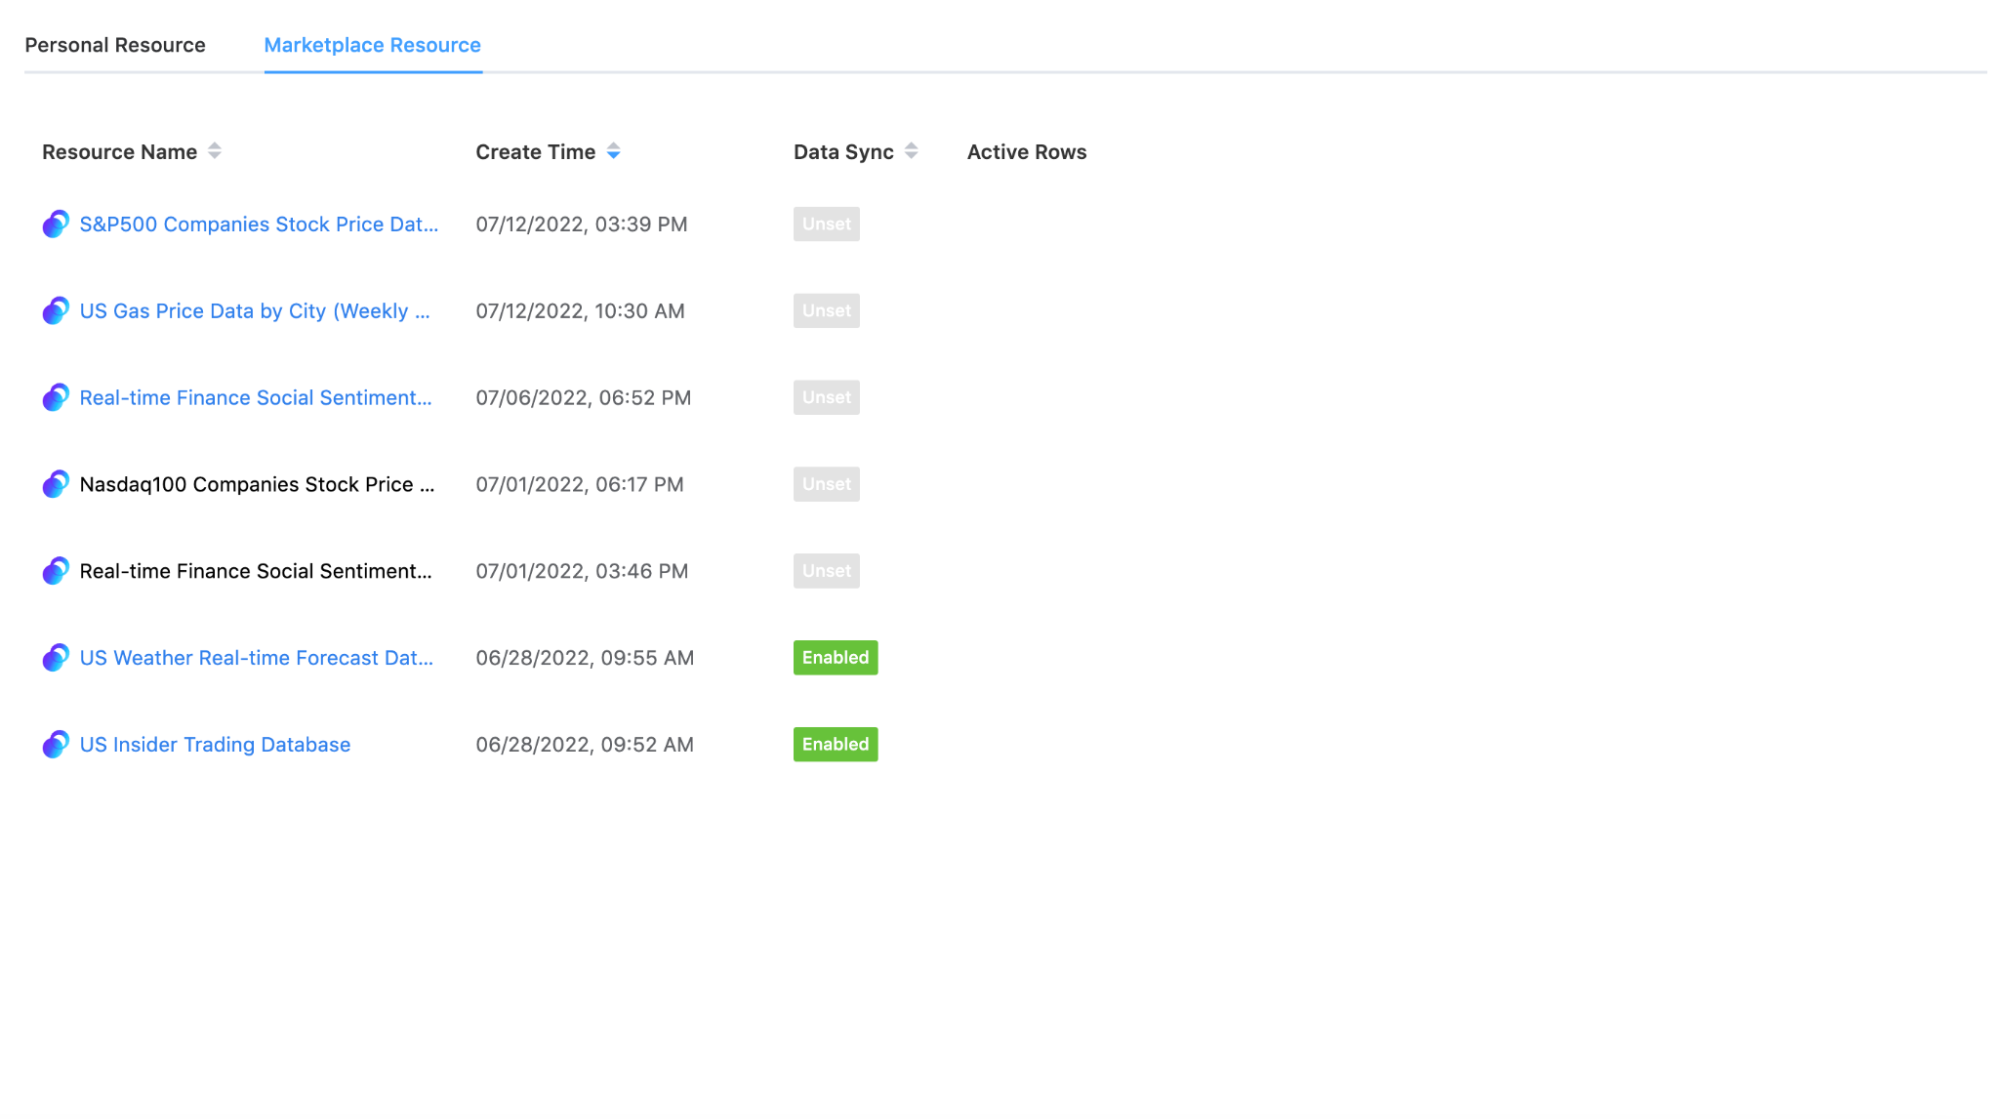
3. Combine the Internal and External Data
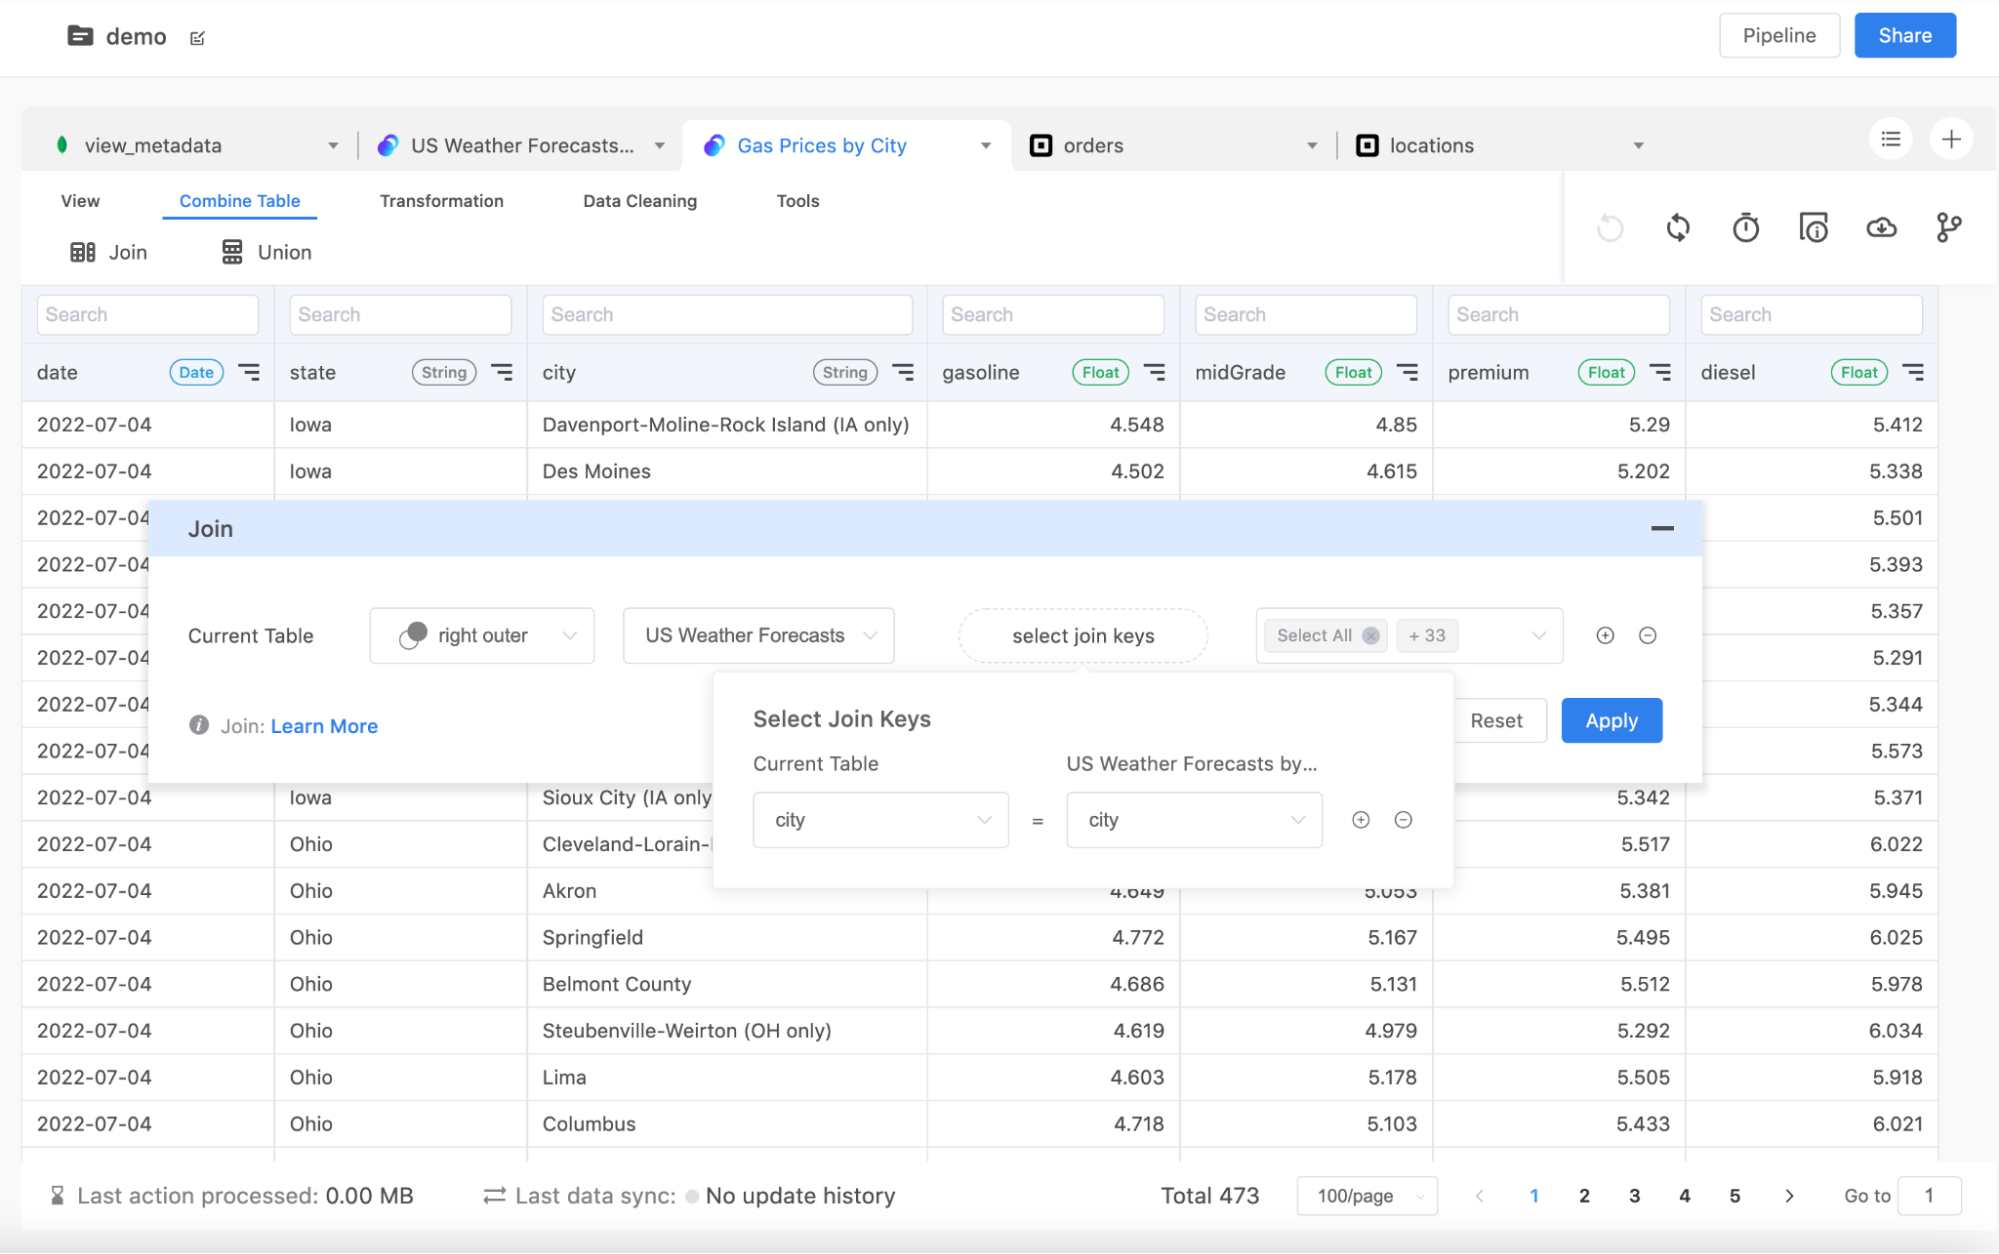
Once both your internal and external data become your resources, now you can import them to a project table for manipulations. Since you can see the table in a tabular format, the built-in data transformations such as “Filter”, “Sort”, “Join”, and “Union” can help you clean the data into a desirable format. For example, the “flatten” action can help you turn JSON objects into relational tables. The “deduplicate” action can remove the duplicated data from the table.
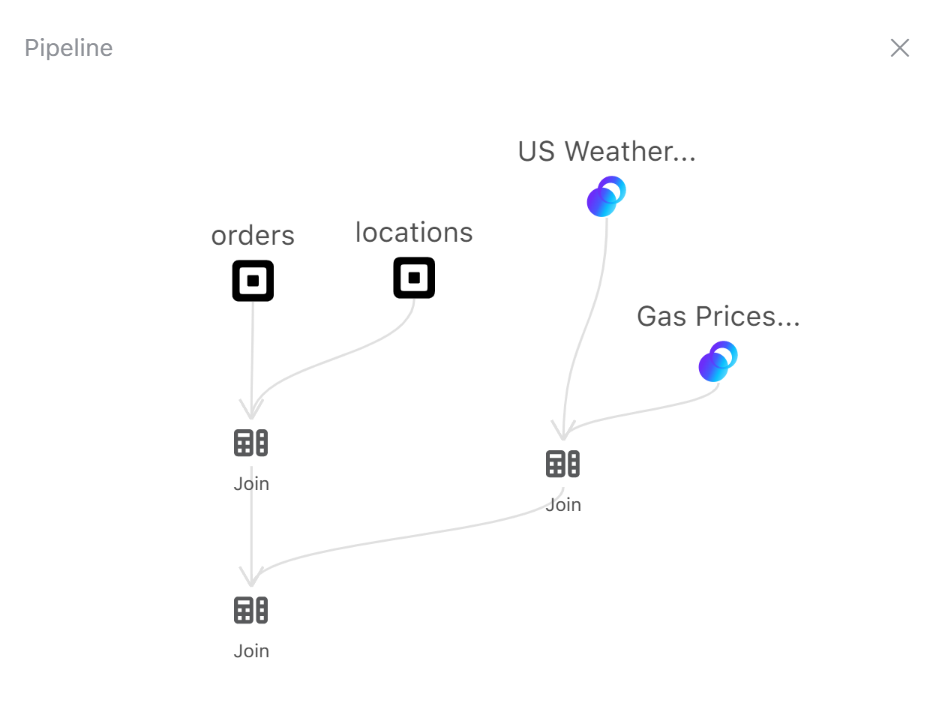
After the data is cleaned, the “Join” and “Union” actions can combine all the tables together. Here I've applied three join actions: one is to combine “order” and “locations” from the Square payment processor. Another one is to combine “US Weather” and “Gas Prices” together. Lastly, I joined the two result tables so I can find correlations between retail sales and gas prices, and bad weather.
4. Detect Patterns and Report Results
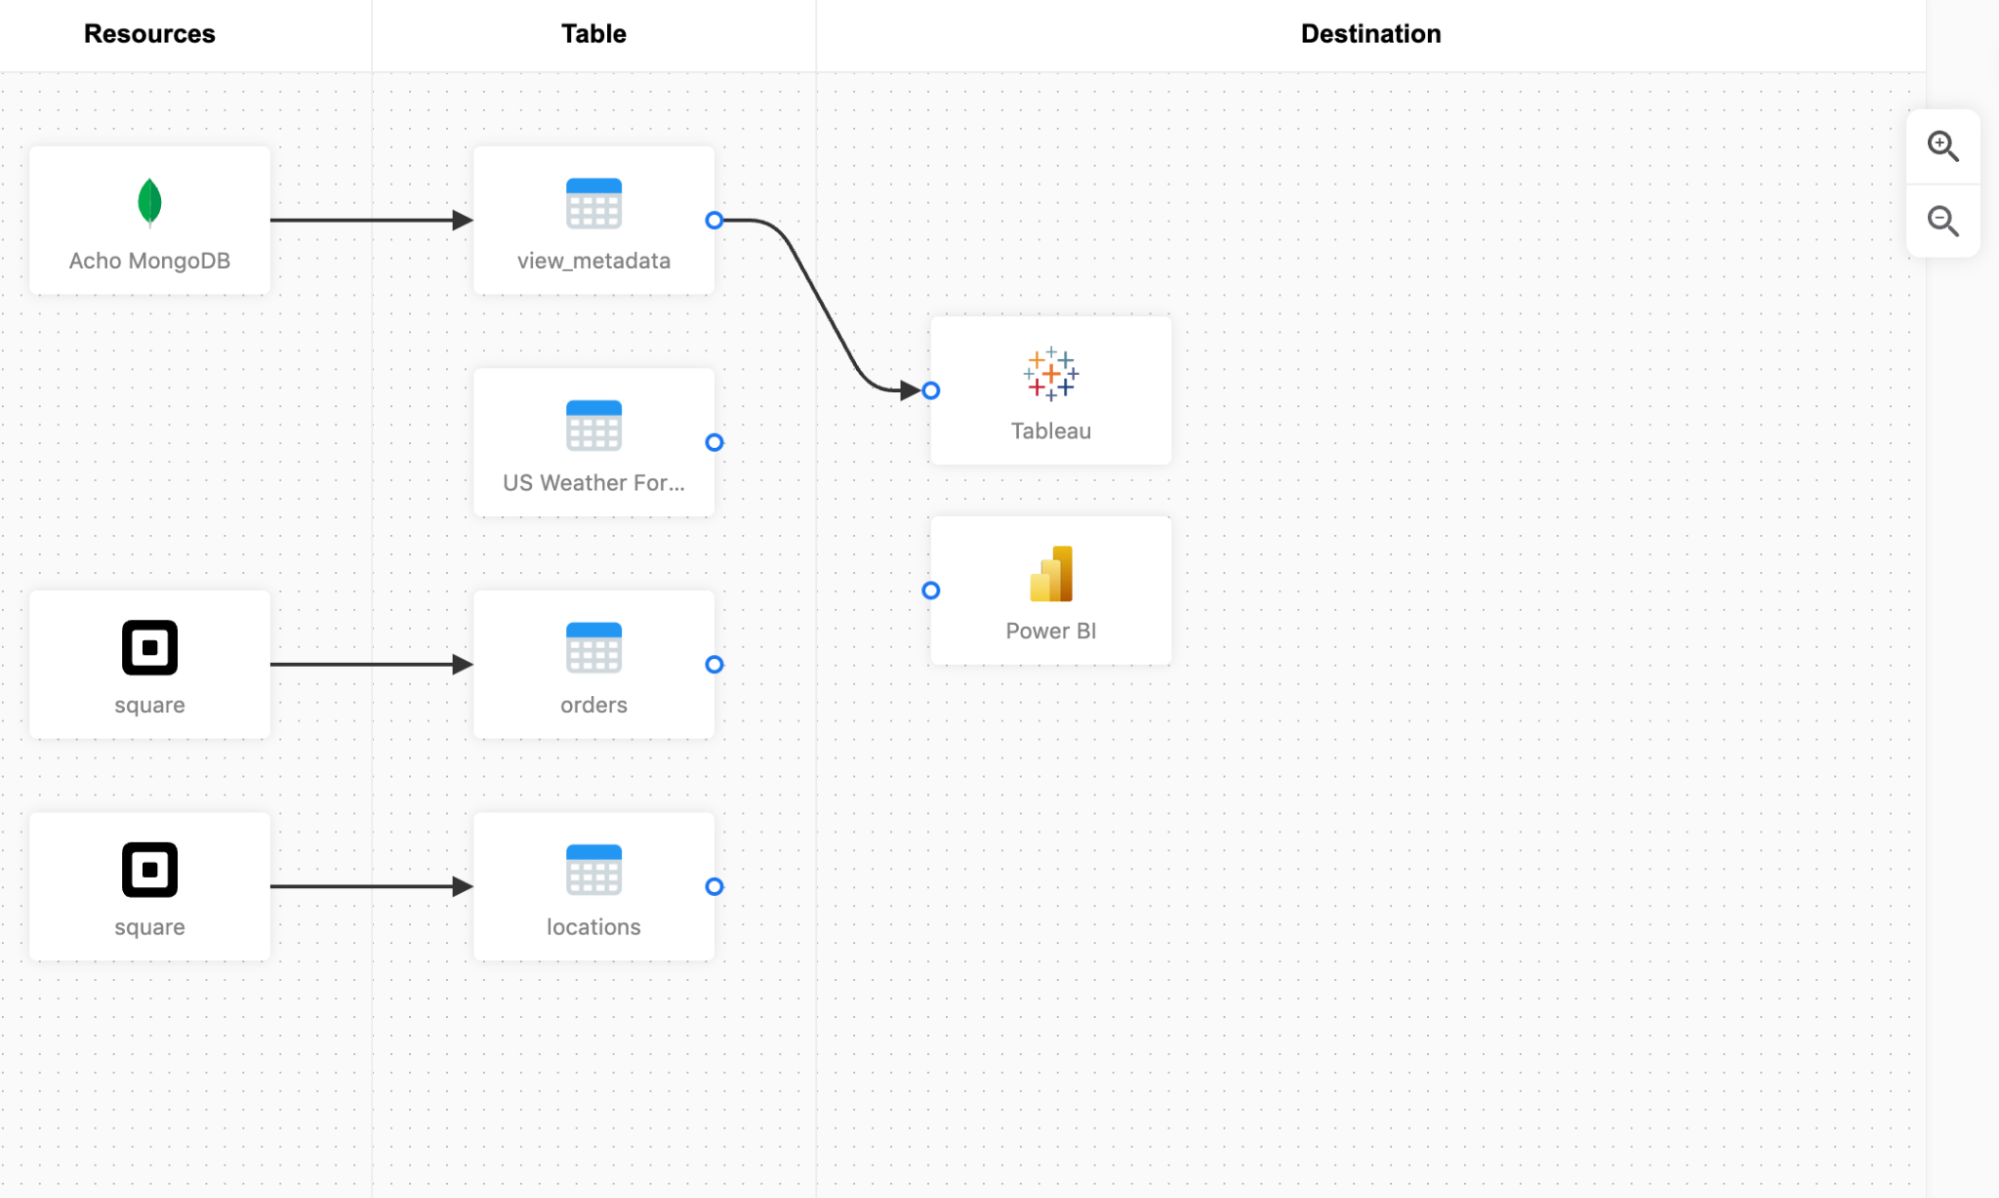
Once the data are connected and combined together, now you can start exploring the new dataset by finding patterns, anomalies, and opportunities to dig deeper. A BI tool will come in handy. Acho comes with a built-in charting app that you can use to visualize data directly from the project tables after transformation and preparation. Alternatively, you can use the Workflow app to send data out to your BI tools such as Tableau or PowerBI.
Hope this article helps. Contact us in the chatbox on the bottom right corner of this page if you have any questions.
- Schedule a Discovery Call
- Chat with Acho: Chat now
- Email us directly: contact@acho.io
Related articles:
>> What is Augmented Analytics?
>> How do you analyze data from MySQL, PostgreSQL, and MongoDB?
>> How to combine dozens of big datasets together in a minute?