A forecasting app is a software application or tool designed to predict future trends, patterns, or values based on historical data. Forecasting apps often leverage statistical techniques, machine learning algorithms, and mathematical models to analyze historical data and generate predictions for future data points. These apps are used across various industries and domains to make informed decisions, optimize resource allocation, and anticipate future demands or trends.
Building a forecasting app with SQL involves several steps, including data extraction, preprocessing, forecasting model implementation, and visualization. While SQL is excellent for data manipulation and extraction, you will need additional tools or languages such as Python, R, or JavaScript for building forecasting models and creating a web-based interface. Here's a step-by-step guide to building a forecasting app with SQL and other tools:
Key Steps for building a forecasting app
- Data extraction:
Extract the data you need for forecasting using SQL. This step involves querying data from a database or data warehouse. Ensure you have access to the database and the appropriate SQL client or interface to run queries.
An example SQL query to extract data:
SELECT date, sales
FROM sales_data
WHERE date >= '2020-01-01' AND date <= '2021-12-31';
2. Data cleansing:
Clean, preprocess, and transform the data to a format suitable for forecasting. This step might involve handling missing values, aggregating data, or converting data types. You can perform some of these tasks using SQL or use a programming language like Python for more complex preprocessing.
3. Forecasting model:
Choose a suitable forecasting model for your data. Time series models like ARIMA, Exponential Smoothing State Space Model (ETS), or more advanced models with Python can be used for forecasting. Implement the model using Python, R, or any other language with relevant libraries.
For instance, if you're using Python, you can leverage the statsmodels library for ARIMA or the fbprophet library for Prophet.
4. Integration with SQL:
Once you've implemented the forecasting model in your chosen language, integrate it with your SQL data extraction process. You can use libraries like pyodbc or sqlalchemy in Python to connect to your SQL database, execute queries, and fetch the results to be used in your forecasting model.
5. Visualization:
Create visualizations to display the forecasted results. You can use libraries like matplotlib or seaborn in Python, ggplot2 in R, or JavaScript libraries like D3.js or Chart.js for creating interactive visualizations.
6. Building the app interface:
Design and build a web-based interface for your forecasting app using HTML, CSS, JavaScript, or an App Builder. You can use JavaScript to fetch data from your forecasting model's API or backend, and display the results in your app interface.
7. Backend and API:
Create a backend server using a web framework like Flask or Django in Python, or Express.js in Node.js. This server will serve as an API to connect your web interface with your forecasting model, handle user input, and return the forecasted results. Implement API endpoints to fetch data from your SQL database, run the forecasting model, and return the results to the front end.
8. Deployment:
Deploy your forecasting app to a web server or cloud. Configure the server, set up the database connection, bind the custom domain with DNS record change, and ensure that the app is running smoothly.
By following these steps, you can create a fully-functional forecasting app using SQL, Python, and web development technologies.
How to build a forecasting app on Acho
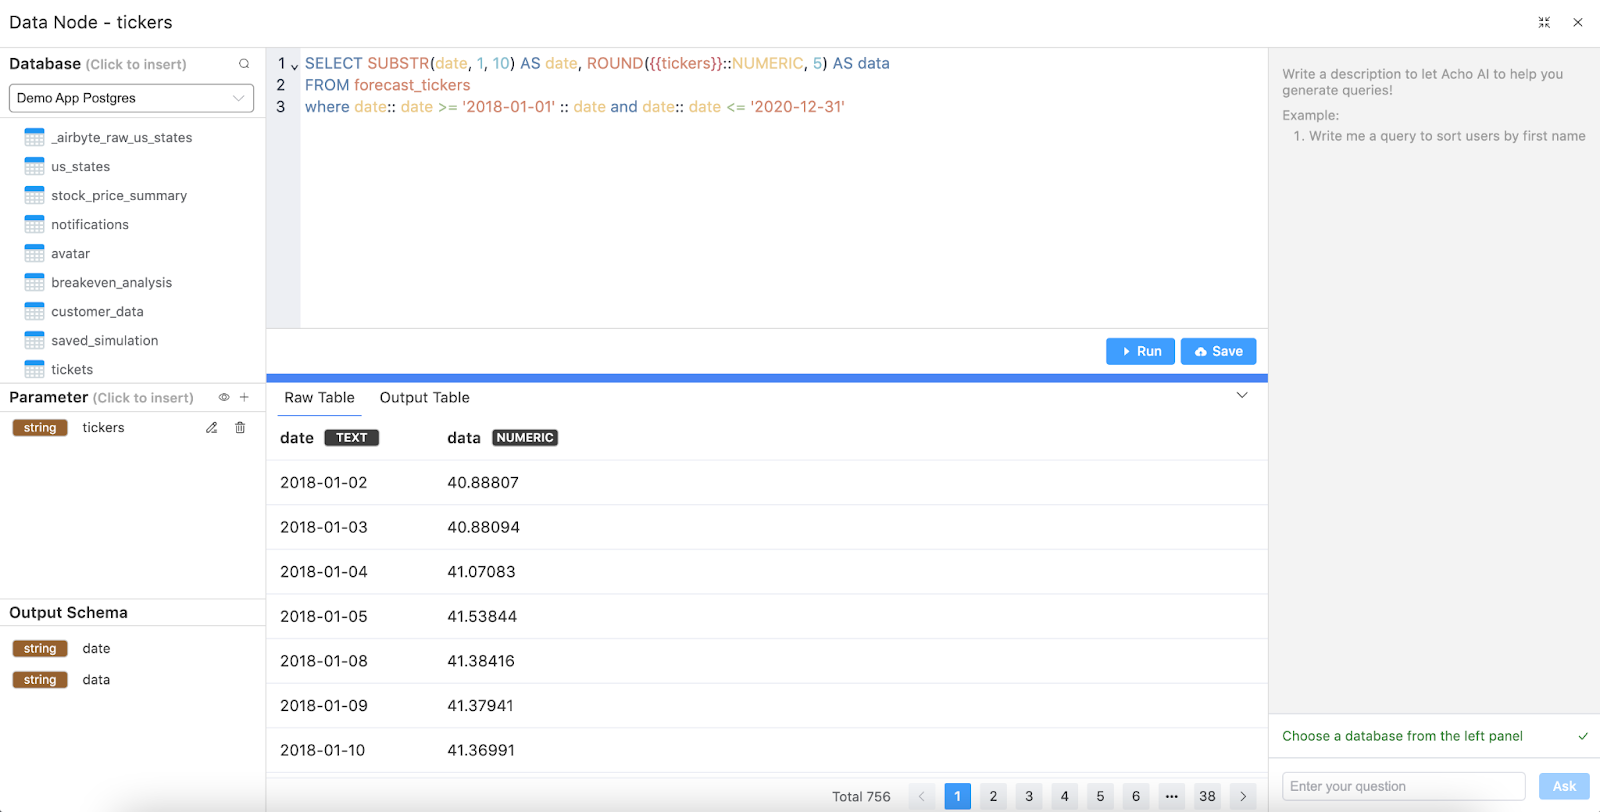
Step 1. Data preparation
1.1 Create a table in the data node to store your historical data.
1.2 Import data into the database using either a CSV file or an API connector.
1.3 You may access these data afterward in data nodes using SQL queries. For example, in the demonstration app, we would utilize one data node to retrieve training data and pass it to the Python node, and another data node to select test data for creating comparative visualizations.
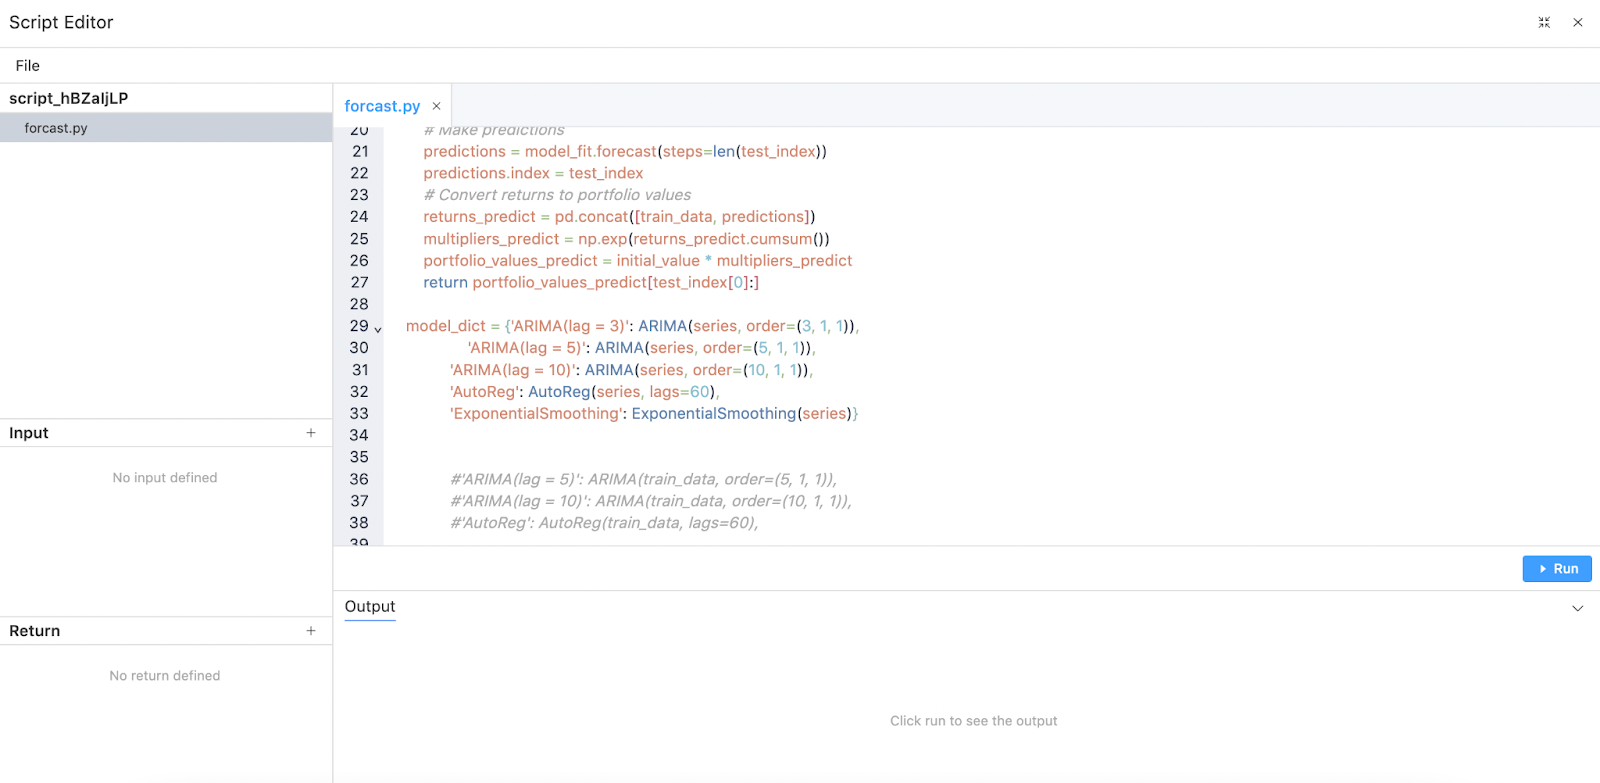
Step 2. Implementing the Predictive Model in Python
2.1 Use the Python node to write a Python script that applies the predictive model to your data.
2.2 The source code provided at the end of this article is a template to help you implement your predictive model. You can modify it according to your needs.
Step 3. Pass decisions and data with Action Flow
3.1 Use Action Flow to enhance the interaction between different elements of the app.
3.2 In this app, we will add a selection for tickers and use Action Flow to pass decisions and data between the data node, Python node, and visualization elements.

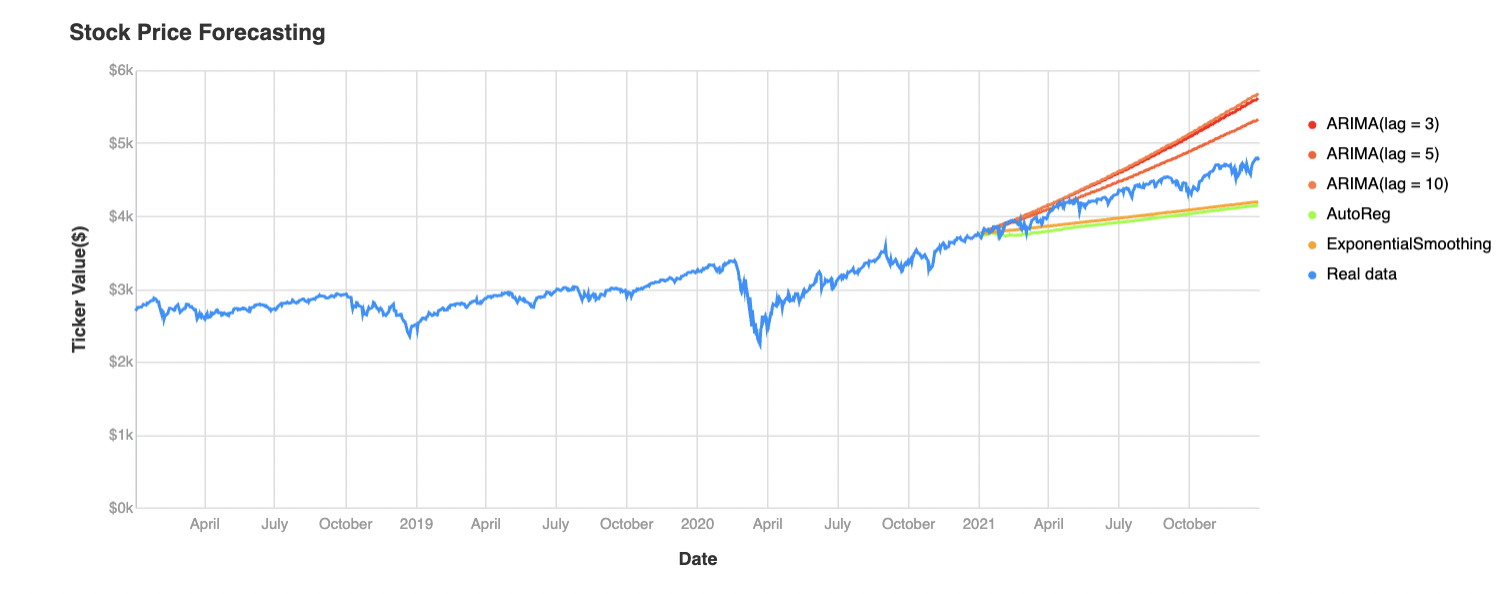
Step 4. Creating Visualizations
4.1 Use the Chart element in the app builder to visualize your data and predictions.
4.2 Select the X and Y fields, and add titles and legends.
Final app:
Embed the app here, URL:
Source code:
import pandas as pd
import numpy as np
from statsmodels.tsa.arima.model import ARIMA
from statsmodels.tsa.ar_model import AutoReg
from statsmodels.tsa.holtwinters import ExponentialSmoothing


def main(payload):
   df = pd.DataFrame(payload)
   df['date'] = pd.to_datetime(df['date'])
   df['data'] = pd.to_numeric(df['data'])
   ini = df['data'][0]
   df.set_index('date', inplace=True)
   log_returns = np.log(df/df.shift(1)).dropna()
   series = log_returns.squeeze()


   def run(model, train_data, initial_value):
       model_fit = model.fit()
       # Make predictions
       predictions = model_fit.forecast(steps=120)
       # Convert returns back to ticker values
       returns_predict = pd.concat([train_data, predictions])
       multipliers_predict = np.exp(returns_predict.cumsum())
       ticker_values_predict = initial_value * multipliers_predict
       return ticker_values_predict


   model_dict = {'ARIMA(lag = 3)': ARIMA(series, order=(3, 1, 1)),
                 'ARIMA(lag = 5)': ARIMA(series, order=(5, 1, 1)),
             'ARIMA(lag = 10)': ARIMA(series, order=(10, 1, 1)),
             'AutoReg': AutoReg(series, lags=60),
             'ExponentialSmoothing': ExponentialSmoothing(series)}

   results = {}
   for name,model in model_dict.items():
       ticker_values_predict = run(model=model, train_data = series, initial_value=ini)
       results[name] = ticker_values_predict


   results = pd.DataFrame(results)
   return pd.DataFrame(results).to_json(orient='records')