Have you ever wanted to use your database like an Excel spreadsheet? I have been using Excel for decades and love how easy and powerful it is when it comes to crunching numbers.
One of my favourite features on Excel is of course the Pivot Table.
It helps you summarize, sort, reorganize, group, count, total or average data in a table. It allows you to transform columns into rows and vice versa. Also it allows you to group values in a column and use advanced calculations.
Building a Pivot Table on a spreadsheet seems to be easy enough. What if you want to build a Pivot Table on a SQL database or a big dataset? Trying to write a SQL expression for a pivot table was very time-consuming, I tried writing a pivot table in MySQL, and the query ran almost 3 pages long! There were more than 100 columns to select from and it would start to get very repetitive.
Alternatively, you can use Acho Studio to build it without writing any SQL codes.
The dataset I’m using is from the Sample dataset available upon account creation. This Covid 19 database from New York Times contains 4 tables; excess_deaths, mask_use_by_country, us_counties, and us_states. Let’s use the us_states table for building our pivot table. The goal is to find out all the confirmed cases by states ranked from high to low since the outbreak started.
Build a Pivot Table
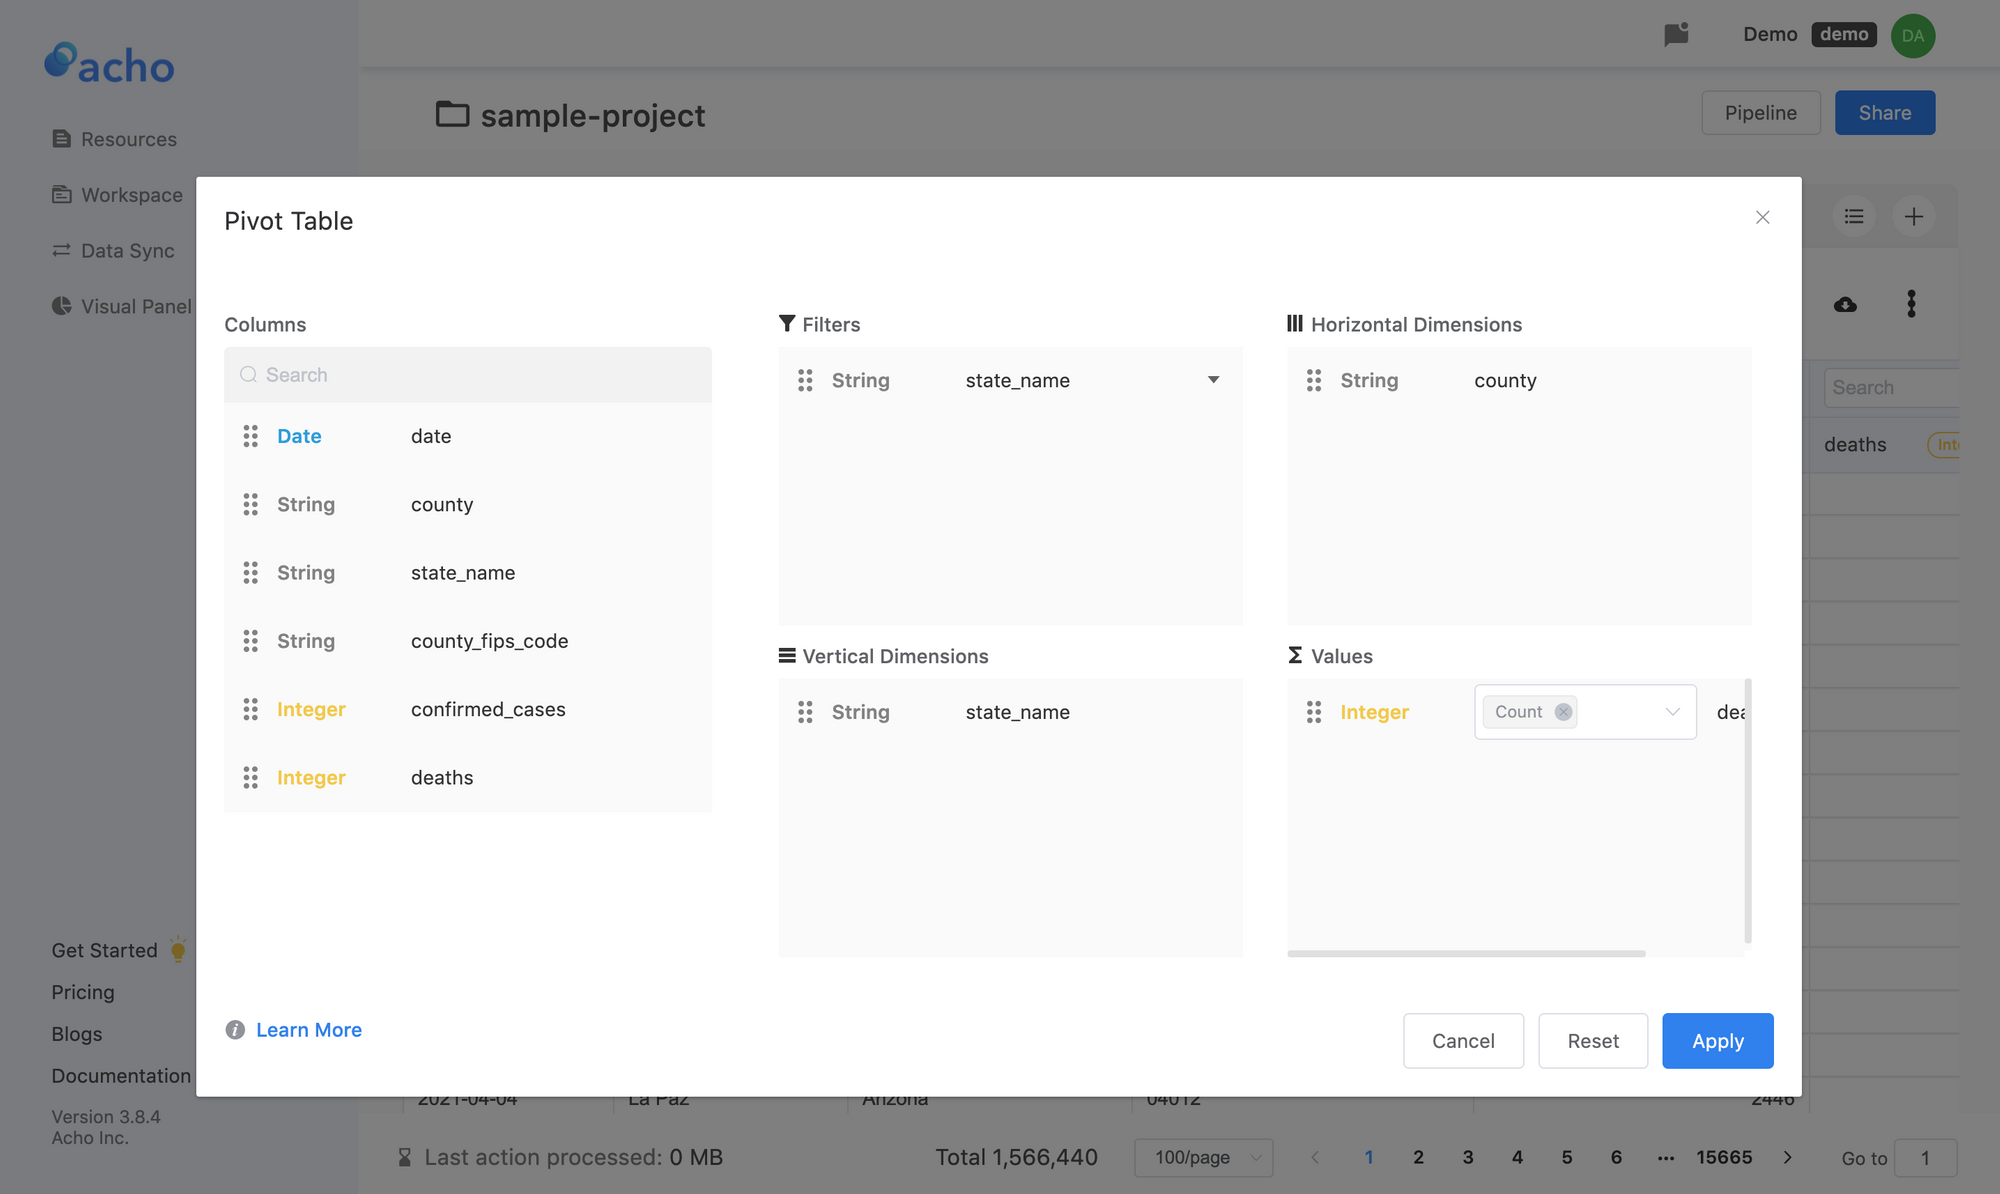
Once you have a table open in the project, you can start using the Pivot Table action. Does it look familiar? The Pivot Table contains 4 input fields: Filter, Vertical Dimensions (columns), Horizontal Dimensions (rows) and Values. The first thing is to determine what to put in either the Vertical Dimensions or Horizontal Dimensions. Once you have specified the columns and rows for the pivot table, you can use the Filter and Values to further narrow down the data you want to see. In this case, let’s put state_name in Vertical Dimensions and confirmed_cases in Values.
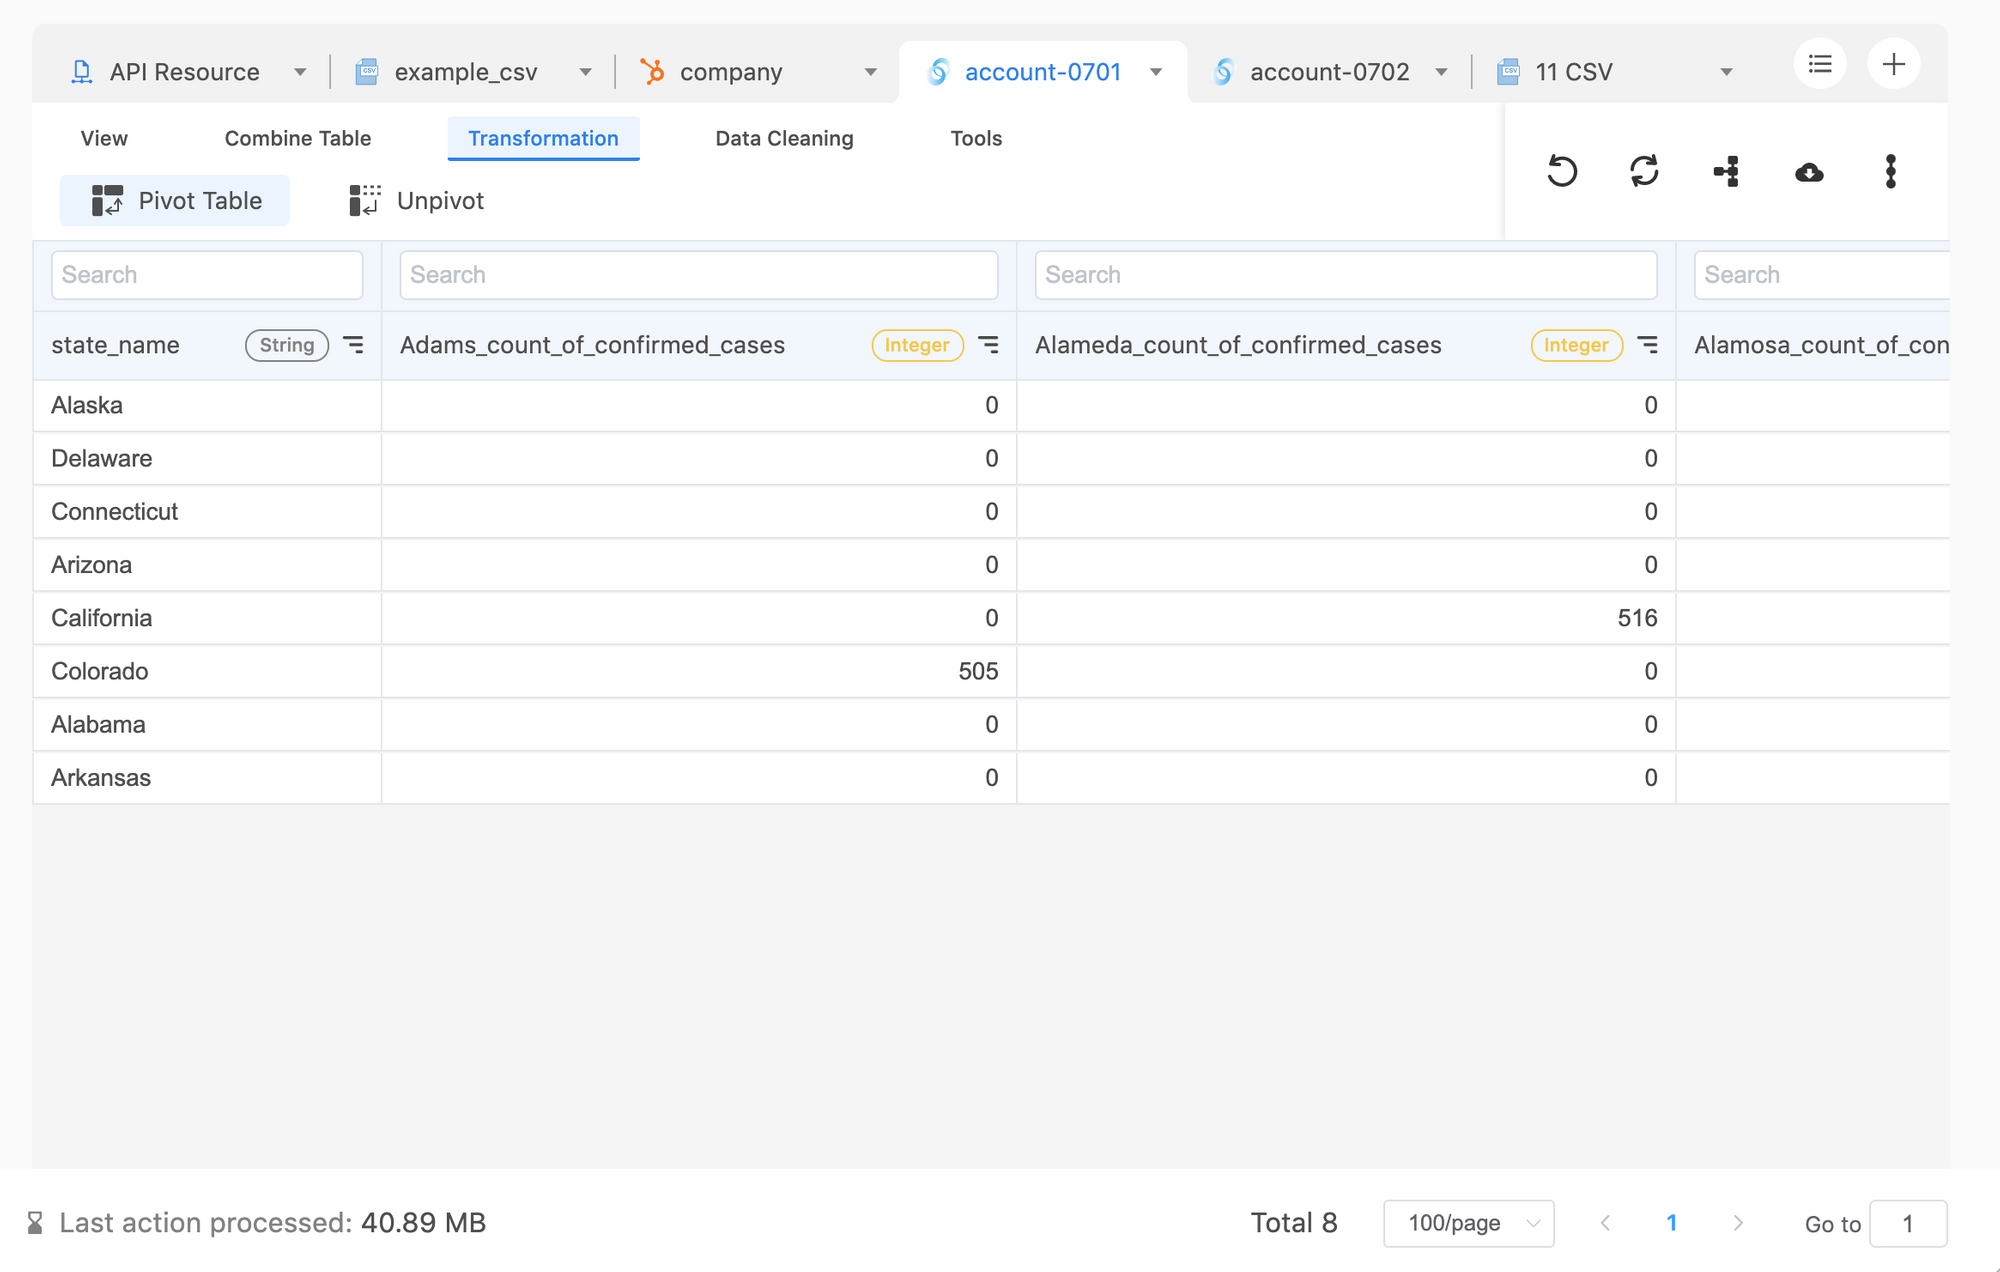
The Pivot Table Result
Now you have all the confirmed cases accumulated since the start of Covid 19 for each state. You can see California being the worst infected state, followed by Texas, Florida and New York.
Edit the Pivot Table
Now reset the sort, and click the Pivot table again. Try applying a filter to the state_name, and limit your ranking to only 5 states. Alternatively, try moving the state_name from vertical dimensions to horizontal dimensions. There are many ways to summarize this table.
Performances
Download the sample dataset (939,888 rows on Jan 18th 2021) and run it on Excel. It would take forever to produce a pivot table if not crash your computer after a while. By leveraging cloud computing resources however, you will produce a pivot table quicker and more reliably. That being said, certain tables or configurations would still take a bit longer than others, but it will keep improving as you grow more familiar with software and your datasets.