Business intelligence (BI) often utilizes different software platforms and services to transform, present, and analyze data that produces executable insights which can help an organization’s strategic and business decisions. Business Intelligence tools are able to access data sets and present findings and trends in reports, dashboards, graphs, charts or even maps to provide users with detailed intelligence about the state of the work.
Why do we use BI tools?
Business intelligence can use various data insights to help companies make better data-driven decisions by visually showing present and past data within their business context. Oftentimes, data analysts would use BI tools to present performance and competitor benchmarks to make the organization identify problems that will make the workflow run smoother and more efficiently. Data analysts and marketers can also use BI tools to easily spot market and data trends to increase an organization’s sales or revenue. When BI tools and data are used effectively, they can help with anything from compliance to brand marketing efforts. Below we have listed a few ways that BI tools can help organizations make data-driven decisions.
Identify ways to increase profit
Business intelligence can provide crucial insights into how the customers behave so you know where to change your marketing strategies to make improvements. BI also shows where you may need to cut expenses. For instance, if your business offers a product or service that does not sell well, you can easily identify the problem through BI tool data analysis and make certain adjustments.
Analyze customer behavior
BI tools can improve the companies’ understandings, predictions and result in influencing the behaviors of customers by using data insights to understand how customers think, act, and spend. With a better understanding of customers’ needs, wants, and behavior you will be in a better position to serve them, to increase profit from existing customers, and to acquire more targeted new customers.
Compare data with competitors
BI tools can provide businesses with the opportunity to track competitors' performance. This is extremely beneficial to the business’s success by understanding how you can gain an edge over your competition.
Optimize operations
BI tools utilize unified data sources to improve organizational structures. Having unified data means that users and organizations will spend less time searching for specific pieces of information, which will give them more time to analyze the data and produce reports that will be helpful in driving the organization’s success.
Spot market trends
Using BI tools to Identify data trends in the market and build strategies around these trends will not only bring your business a competitive advantage, but it also helps employees to gather relevant market data and generate analysis quickly and more efficiently.
How to choose a BI tool for your business?
Before choosing a specific BI tool to use, you should first evaluate the different features that you would want the BI tool to have to best achieve your goal. The BI tool you choose should make data insights clearer and easier to use. Below we have listed some questions you should consider as you compare the options of your BI tool before choosing the one to use.
Who will be using the BI tool?
BI tools are typically geared toward either business users or data teams. Some tools prioritize ease of use, while others enable data analysts to perform complex queries with code.
Does the data need to be transformed?
For some BI tools, the ability to transform data tends to be absent or very limited. Drag-and-drop features are more intuitive for business users, but you might run into issues if your data isn’t already clean. Some BI tools offer the ability to clean and transform the data within the platform before producing any useful insights.
Where does your data live?
Many BI tools can integrate a variety of data sources — whether your data is on-cloud or on-premises. Some BI tools can integrate with your data warehouse instead of individual data sources. If you need real-time analysis, make sure your BI tool integrates with the data sources it will need to collect real-time data from. An example would be integrating data sources through REST APIs.
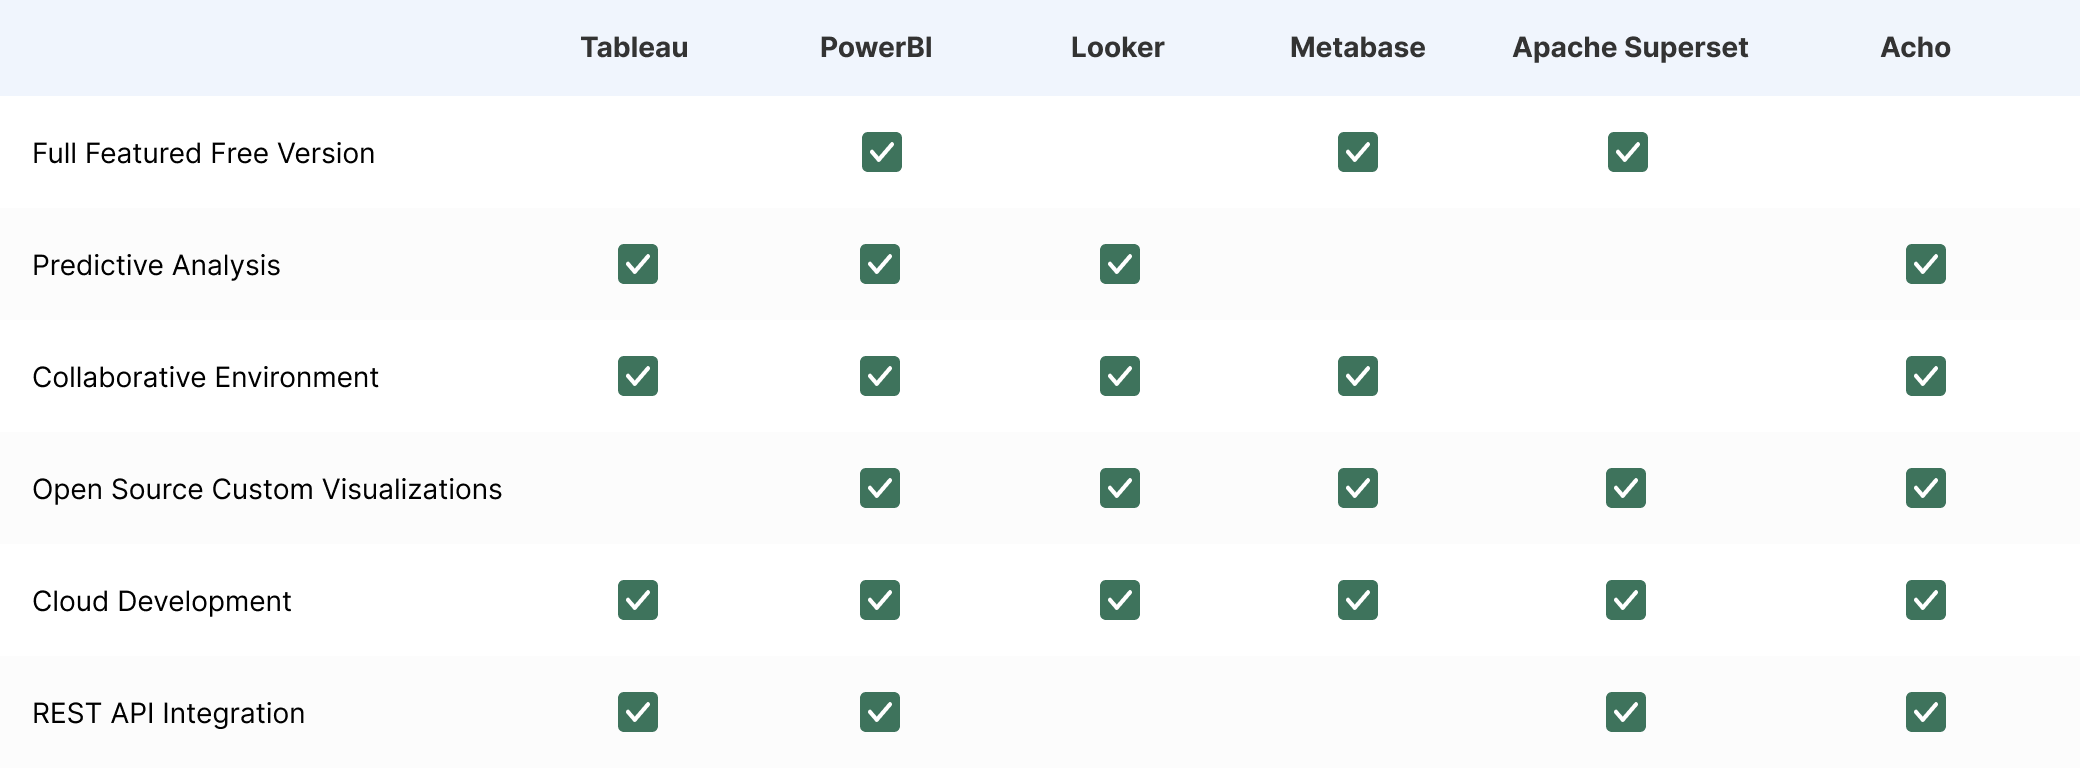
Comparing different BI tools
Now with the requirements that you need in BI tools, it is time to compare the different types of BI tools on the market today and choose the best option that fits your needs.
Tableau

Tableau is a type of BI tool where it specializes in making visualizations, but much of their advertising is focused on corporate environments with data engineers and bigger budgets. There’s a public version of the tool with limited capabilities. To access more features offered by Tableau, the users would need to pay more, features like that would include benchmarked data from third parties.
PowerBI

Power BI is another BI tool where it is also a collection of software services, apps, and connectors that work together to turn your unrelated sources of data into coherent, visually immersive, and interactive insights. The data source being imported into PowerBI can include Excel spreadsheets, or a collection of cloud-based and on-premises hybrid data warehouses.
Looker

Looker is a business intelligence and data visualization platform made for companies with an existing data analytics team. Use their LookML to define business data, and then business users have the freedsom to combine, drill down, and analyze that data in real time in dashboards and reports. Looker connects to existing company databases and keeps data up to date. Users can use natural language that matches with the company’s custom LookML settings to build their own reports.
Metabase

Metabase is an open source business intelligence tool where it is written in Java and can be deployed on various platforms. With Metabase users can connect to various database engines. After that the users would be able to slice and dice the imported data in endless ways. In the Metabase terminology a query is called a question. So when the users ask a question to the datasets that you are working with, Metabase will give you an answer. Depending on your question this answer can be a single value, a results table or a graphical representation with lots of details.
Apache Superset

Apache Superset is a modern, open source BI app with a simple interface, feature-rich when it comes to views, that allows the user to create and share dashboards. Apache Superset is simple to use and does not require programming, and allows the user to explore, filter and organise data. They appeal to a wide range of users with different coding backgrounds. Users can explore each dashboard in a complex way where it allows you to focus on each graph/metric and easily filter and organise.
Acho

Acho is a low-code, cloud-based, end-to-end data application platform. You can connect to any data source, clean and transform your data, and use the data to build customizable applications – all with this one tool. Applications are built with highly customizable drag-and-drop options that users of various technical backgrounds will be able to implement to build a report. Users can filter data, drill down for details, and even write back to databases or other apps. Users will not only be able to draw executable insights from the dashboards, but take action directly in the application as well.
With the power of business intelligence and the different platforms users can access and create graphs, reports and dashboards to display key insights and trends, organizations can benefit from the visualizations to produce and make better data-driven decisions that eventually drives the success of the business.
Contact us in the chatbox on the bottom right corner of this page if you have any questions!
- Schedule a Discovery Call
- Chat with Acho: Chat now
- Email us directly: contact@acho.io