Real world data is often messy and messy data can lead to flawed conclusions and a waste of resources. Especially in a world of data-driven decision making, it’s vital to ensure that your data is clean and prepared for analyses so you are making the most accurate insights to base your business decisions on.
What is data cleaning?
Data cleaning is the process of fixing or removing incorrect, incomplete, duplicate, corrupted, incorrectly structured, or otherwise erroneous data in a data set. These issues can arise from human error during data entry, merging different data structures, or combining different datasets that might use different terminology. Many of these errors can lead to wrong but believable results, skewing our understanding of the data.
Why is data cleaning important?
Important business strategies, such as allocating funds and improving customer service, are often supported by data. When this data is questionable, the insights gathered from it and the consequential decisions can easily steer businesses down the wrong path. Data cleaning will improve the quality of information on which you base your decisions.
Data cleaning can also increase productivity. For example, customer data can often be inconsistent or out of date. Cleaning CRM and sales data can improve the productivity of sales and marketing efforts by eliminating the need to wade through outdated or incorrect data.
Data cleaning overview
The specifics for data cleaning will vary depending on the nature of your dataset and what it will be used for. However, the general process is similar across the board.
Here is a 8-step data cleaning process that will help you prepare your data:
- Remove irrelevant data
- Remove duplicate data
- Fix structural errors
- Do type conversion
- Handle missing data
- Deal with outliers
- Standardize/Normalize data
- Validate data
Why you should learn how to clean data with SQL
Data cleaning can be done in a scripting language such as R or Python. Many BI platforms also have built-in operations for data cleaning. If there are other ways to clean data, what makes SQL so important?
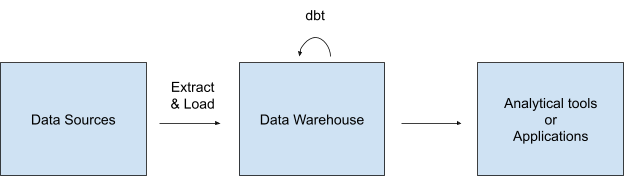
For most companies, data is stored in databases or data warehouses. Data can be collected from various data sources and loaded into data warehouses via ETL or ELT tools. Then, data workers can retrieve data from data warehouses and build reports or applications. The process from data sources to data applications is called a data pipeline.
In a data pipeline, messy data usually exists in data sources or data warehouses. Many ETL tools support writing SQL to transform and clean data before loading it to data warehouses. Both ETL and ELT require writing SQL to transform or clean data.
In addition, dbt (data build tool) has recently become a popular tool for speeding up the process of data transformation and building data pipelines. It allows you to create your entire transformation process in your data warehouse with SQL. Many data engineers use it to transform and clean data in data warehouses.
SQL is a necessary process in most data pipelines. Using SQL to clean data is much more efficient than scripting languages if your database is built on cloud.
How do you clean data in SQL?
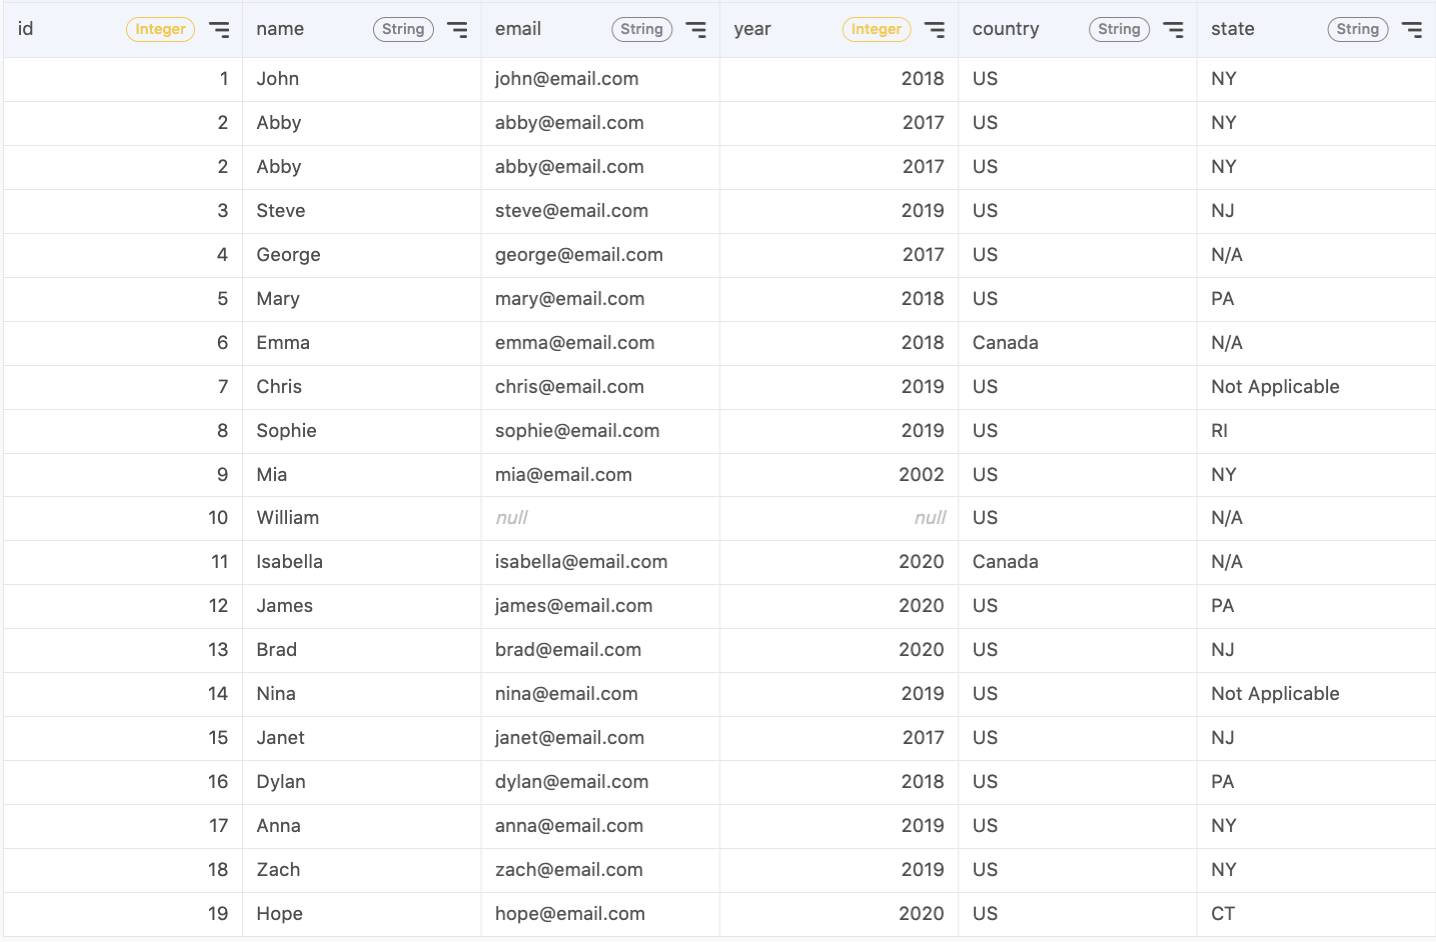
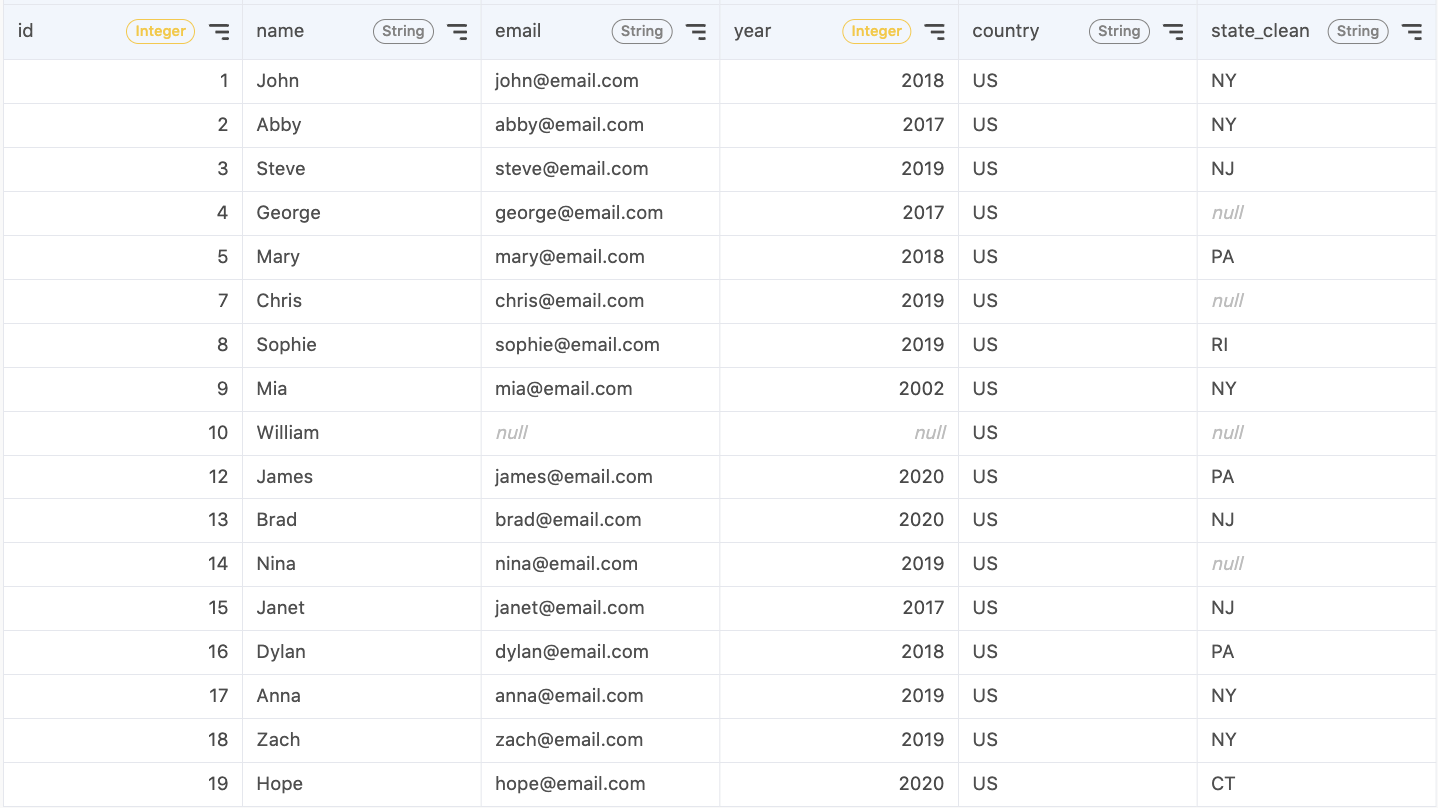
In this section, I’ll show you some example SQL statements you can write to clean your data. I’ll mainly be working with a table storing customers’ contact information for a store that opened in 2017. This includes the customer’s name, email, the year of first purchase, and the country and state they reside in.
1. Remove irrelevant data
What’s considered irrelevant data will vary based on the dataset. You need to figure out what data is relevant to your analyses and the questions you’re asking.
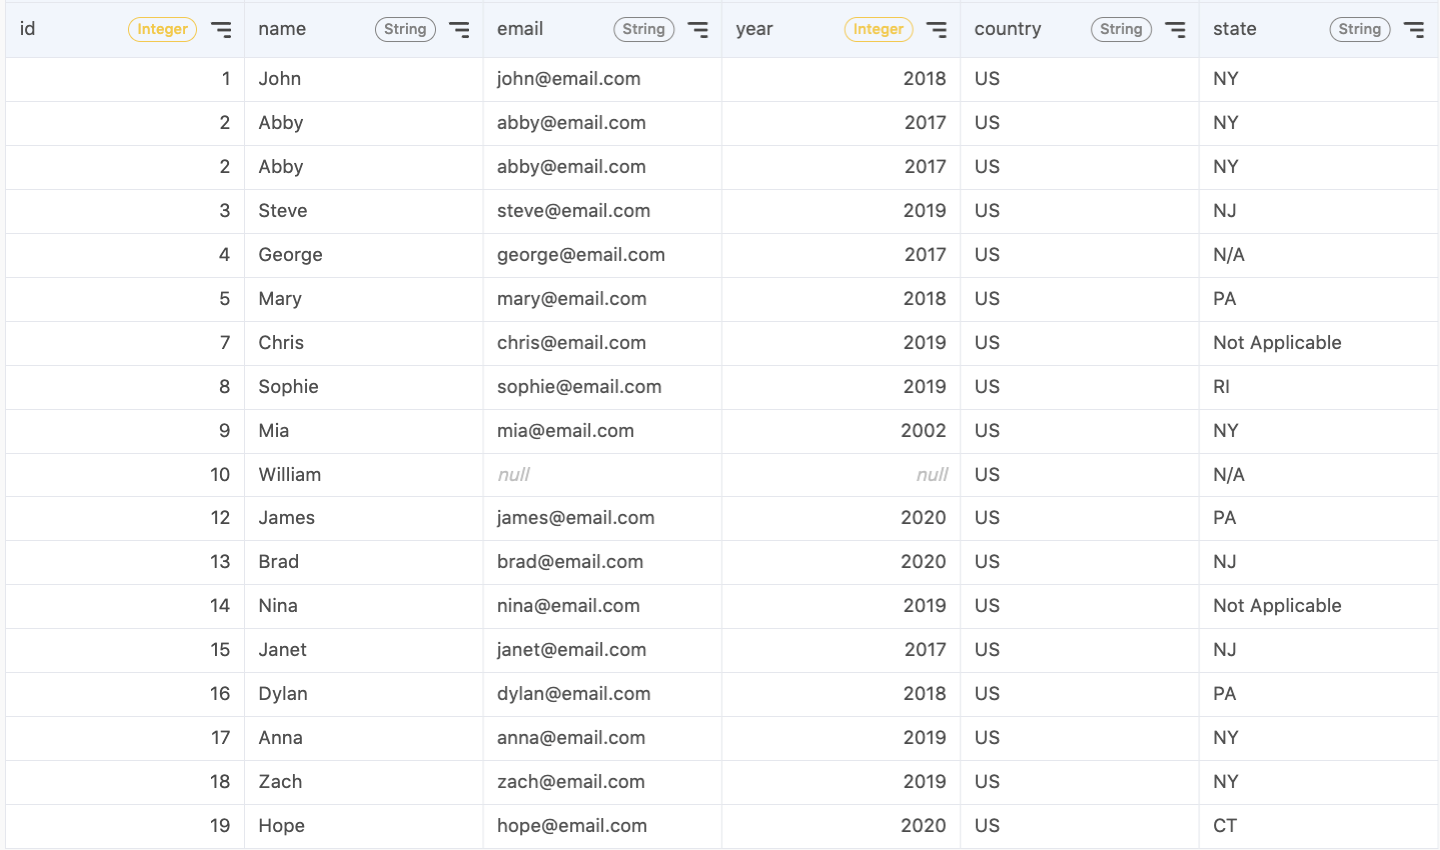
Let’s say I’m only interested in customers who live in the US. Data from customers who live outside of the US will skew my results, and I should remove them from the dataset. I can filter them out with the following statement:
With this statement, we’ll only keep the records where the customer’s country is listed as "US".
2. Remove duplicate data
Duplicate data is common to come across, whether your data is scraped, collected from surveys, or gathered from multiple sources. Duplicate data is inefficient to store and can cause your analysis to weigh duplicated records more heavily.
I notice there is duplicate data in my table. There are two entries for Abby with the same id. I can remove duplicate data and keep only one occurrence:
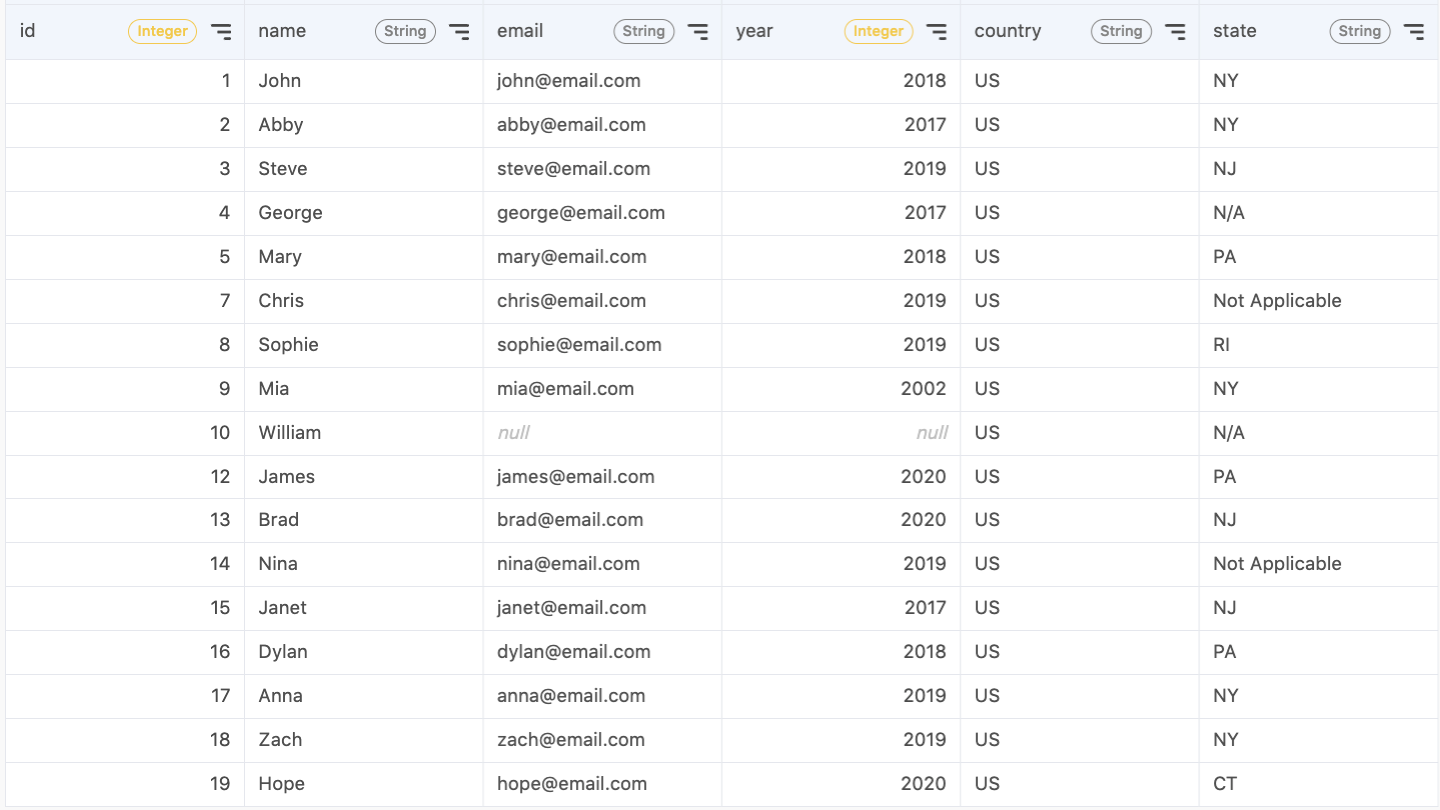
However, you should be careful when using SELECT DISTINCT *. The query will be computationally expensive if your table has dozens of columns. A more efficient way is to use ROW_NUMBER() to remove duplicate records. ROW_NUMBER() can partition data into small groups and assign a sequential integer number to each row. In this example, since we only need to keep the latest record for each customer id, you can run the following query:
3. Fix structural errors
Structural errors include strange naming conventions, typos, or incorrect capitalization. They usually arise when you measure or transfer data.
In the state column of our data, we see that there are instances of both "N/A" and "Not Applicable" even though they represent the same group. This error should be fixed by standardizing the convention. This statement will create a new column state_clean that will replace "N/A" and "Not Applicable" with a NULL value.
Here are other structural issues you might encounter:
- Unnecessary spaces at the beginning or the end of the string. For example, " Apple " should be trimmed to be "Apple". This can be done with
TRIM(),LTRIM(), orRTRIM()functions. - Incorrect capitalization, such as "apple" as a company name should be "Apple". This can be fixed with the
INITCAP()function.UPPER()andLOWER()can turn texts into all uppercase or lowercase. - Remove or replace some of the characters or terms. Suppose you want to turn "Apple Company" into "Apple Inc". You can use
REPLACE()to replace "Company" with "Inc".
4. Do type Conversions
Type conversion is important to maintain consistency. Numbers, for example, are a common data type you’ll need to convert. They are often imputed as text, but for them to be processed and used for calculations, they need to appear as numerals.
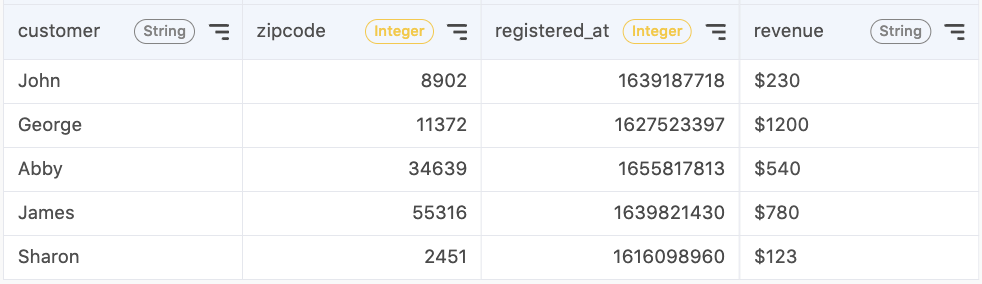
Consider another example and a new table.
Here are some examples of issues that we can handle with type conversions:
- The "zip code" column lacks leading 0s since the field is categorized as a numerical column by the system
- The "registered_at" column is displayed in a UNIX timestamp but it's not a human-readable format.
- Values in the "revenue” column contain a string character, "$". In databases, this field will be considered as a string column and thus is not allowed to do mathematical calculations.
This will convert the "zipcode" type to string and add a leading 0 when applicable. It will also display "registered_at" as a human-readable timestamp. In the "revenue" column, the "$" will be removed and the value will be converted to an integer.
5. Handle missing data
Handling missing data is a more complex process. Many algorithms and analysis tools won’t accept missing values, and the way missing data is handled will depend on the nature of it. There are a couple of options, both of which are not optimal due to a loss of information but can be implemented while minimizing negative impact.
The first option is to remove any observations that have missing values. This method of removing rows is simple, but can cause you to lose information. Be careful when you remove data and be aware of how your data can be affected, especially if there are not enough observations left to result in a reliable analysis or if the missing data has a structured pattern to it.
The second option is to replace missing values. For example, for categorical data, you can label missing data as ‘missing’. For numerical data, you can replace missing values based on other observations such as the mean or median. This method requires making assumptions, which has the potential to decrease the integrity of your data. For example, if you’re missing a lot of data, using a mean or a median can result in a loss of variation in the data.
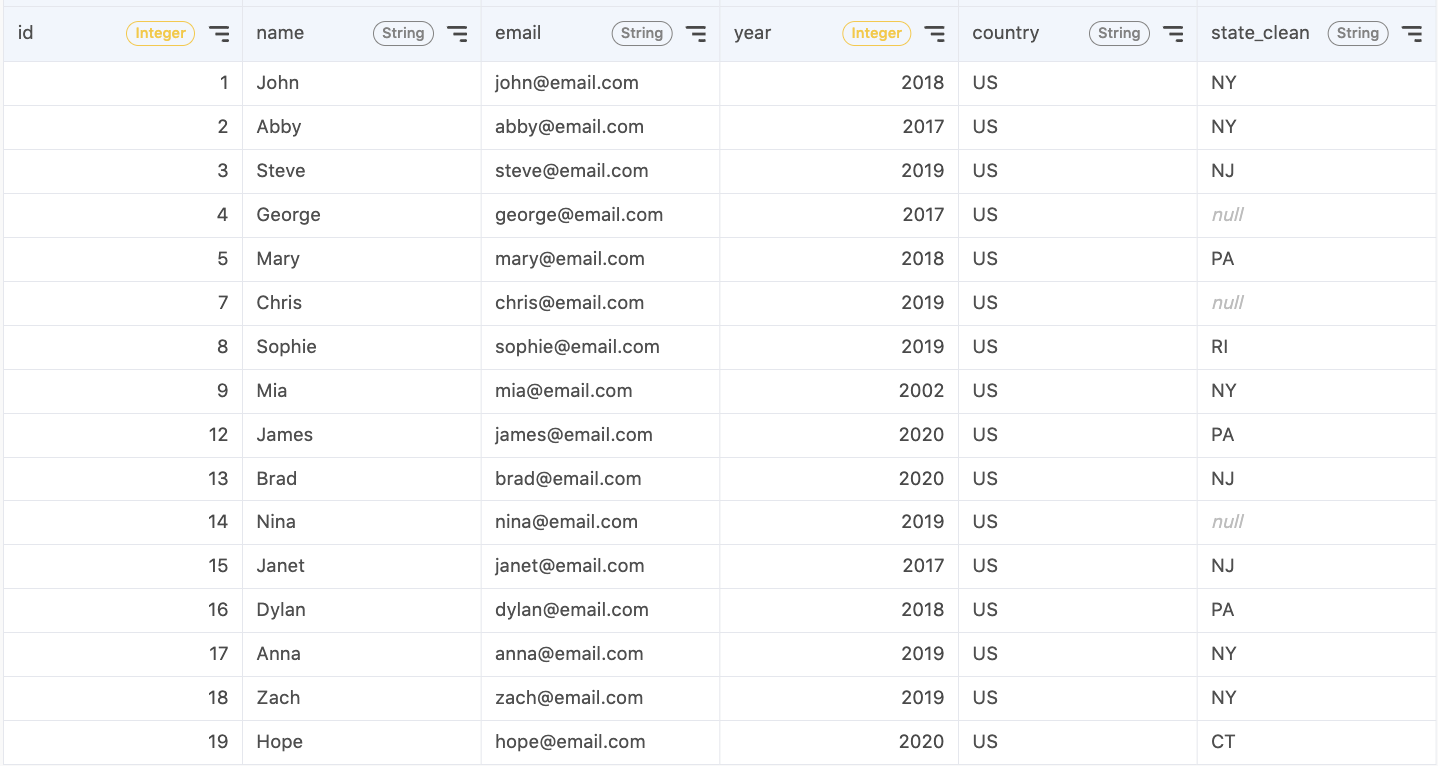
In our data, we have an observation with a missing year. If we’re trying to understand customer acquisition over the years, missing year data is a problem. In this case, there is no way to replace this missing value based on other values, so we can try removing it.
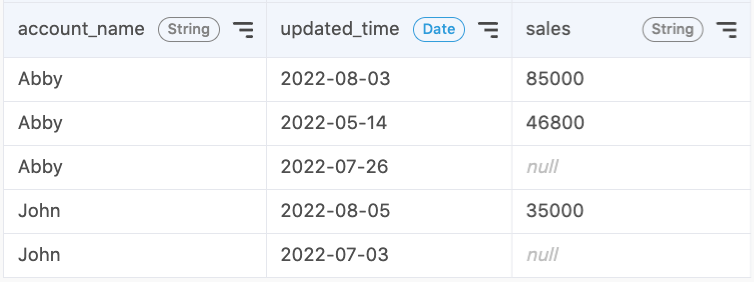
Another way is to impute missing data with a specific value. The following statement will replace all null values in the sales column with 0.
6. Deal with outliers
Often, you’ll encounter one-off observations that don’t seem to fit in with the others. What to do with an outlier depends on the reason for the outlier. If there’s an outlier due to improper data entry, it might help to remove the data. However, if outliers are valid, you need to make more careful considerations. You could remove outliers if they are irrelevant to your analysis, but otherwise outliers can be a meaningful part of your data.
In this new table, we have some numerical data on the revenue generated by each person.
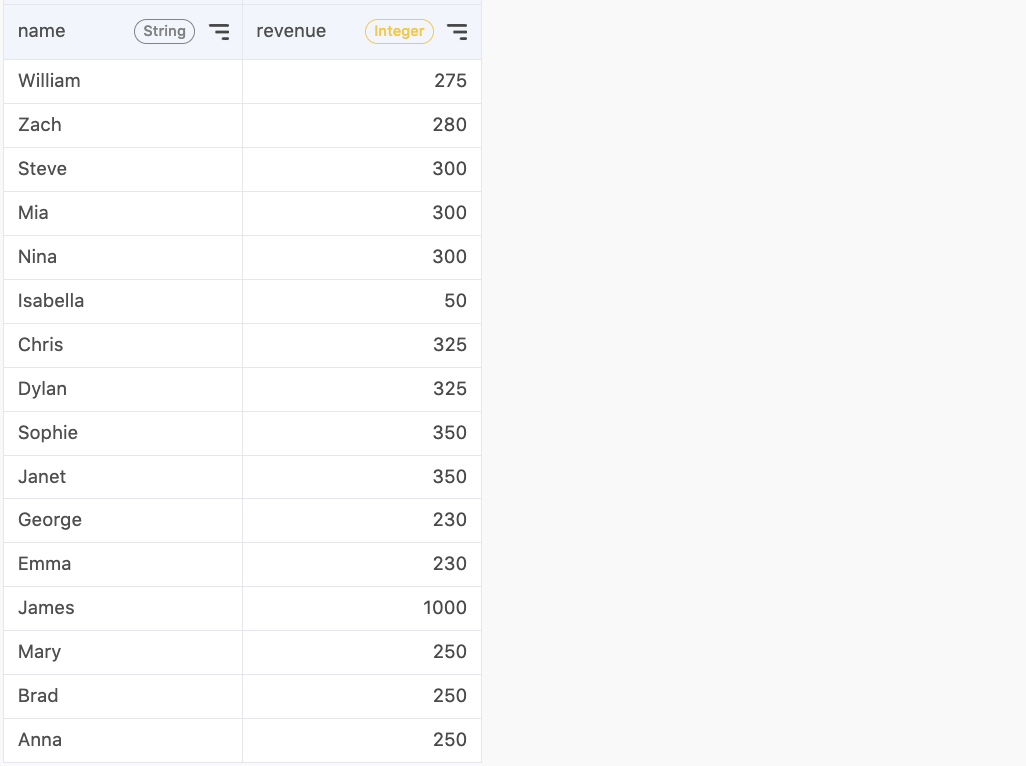
One way to identify outliers is to use the interquartile rule. Suspected outliers are values at least 1.5 * IQR below the first-quartile or above the third-quartile. The following code will replace all outliers with the mean of all other observations.
7. Standardize/Normalize data
Standardizing data is transforming data into a consistent format. This can include unit consistency such as temperature, which can be displayed as Fahrenheit or Celsius. This also includes scale consistency, such as turning scores from a 5-point scale to a 100-point scale.
Consider a table called temperatures with a column measured in Fahrenheit. The following code will create a new column that converts temperature to Celsius.
Turning scores from a 5 point scale to a 100 point scale can be done as follows:
8. Validate data
The last step is to validate your data. At the end of the data cleaning process, you need to ensure that your data is valid, accurate, complete, consistent, and uniform. Some questions you can ask yourself are:
- Do you have enough data?
- Does the data follow the constraints for its field?
- Does your clean data prove or disprove your theory before analysis? Does the data make sense?
Validating data can prevent false conclusions based on low-quality data.
There’s no single correct way to clean your data. These 8 steps are a good guideline for what procedure you should follow and what issues to look for in your data. While no data is perfect, monitoring errors and understanding where they’re coming from can make the data cleaning process much easier in the future.
Data with fewer errors make for happier clients, less frustrated employees, and more efficient business practices.
- Schedule a Discovery Call
- Chat with Acho: Chat now
- Email us directly: contact@acho.io
>>
How to build an Applicant Tracking System (ATS)?
>>
How to build an app with only SQL?
>>
How to Share Data Between Two Applications