What is User Stickiness?
User stickiness is a concept for evaluating the depth of user engagement. It represents how often users visit your website or use your product. It answers questions such as: “Do they come to your website every day/week/month?”, “Are they willing to spend time on your product?”, and “Do they heavily rely on your product for a particular scenario?”. In essence, measuring user stickiness is a useful way of predicting churn rate and even net promoter score since stickier users can become your loyal customers and promoters at times.
How to Measure User Stickiness?
DAU/MAU Ratio is a useful metric to measure user stickiness. It is calculated from two metrics: Daily Active Users (DAU) and Monthly Active Users (MAU). DAU is the unique number of active users in a day, whereas MAU is the unique number of active users in a month. By dividing DAU by MAU, we can obtain an overview of how often your users engage with your product.

For example, if DAU is 100 and MAU is 400, then DAU/MAU Ratio is 100/400 = 25%. It means that a user spends 25% of a month to use your product on average.
You may wonder: why we don't just use DAU and MAU to measure stickiness? DAU and MAU are absolute values, not relative values. In other words, the growth of DAU and MAU doesn't necessarily indicate a growth of stickiness.
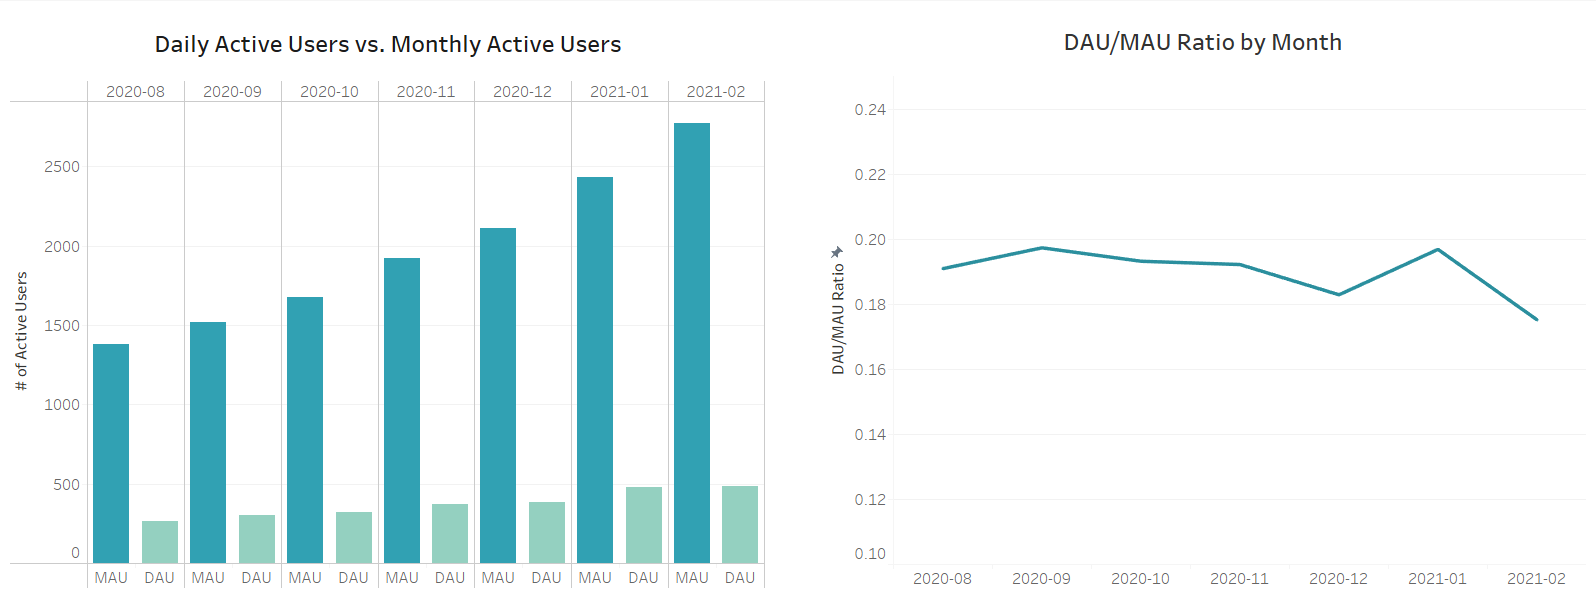
Take the following graph as an example. As you can see, DAU and MAU seem to grow over time but DAU/MAU Ratio remain stable. Although the number of active users increase, they still spend the same amount of time on your product.
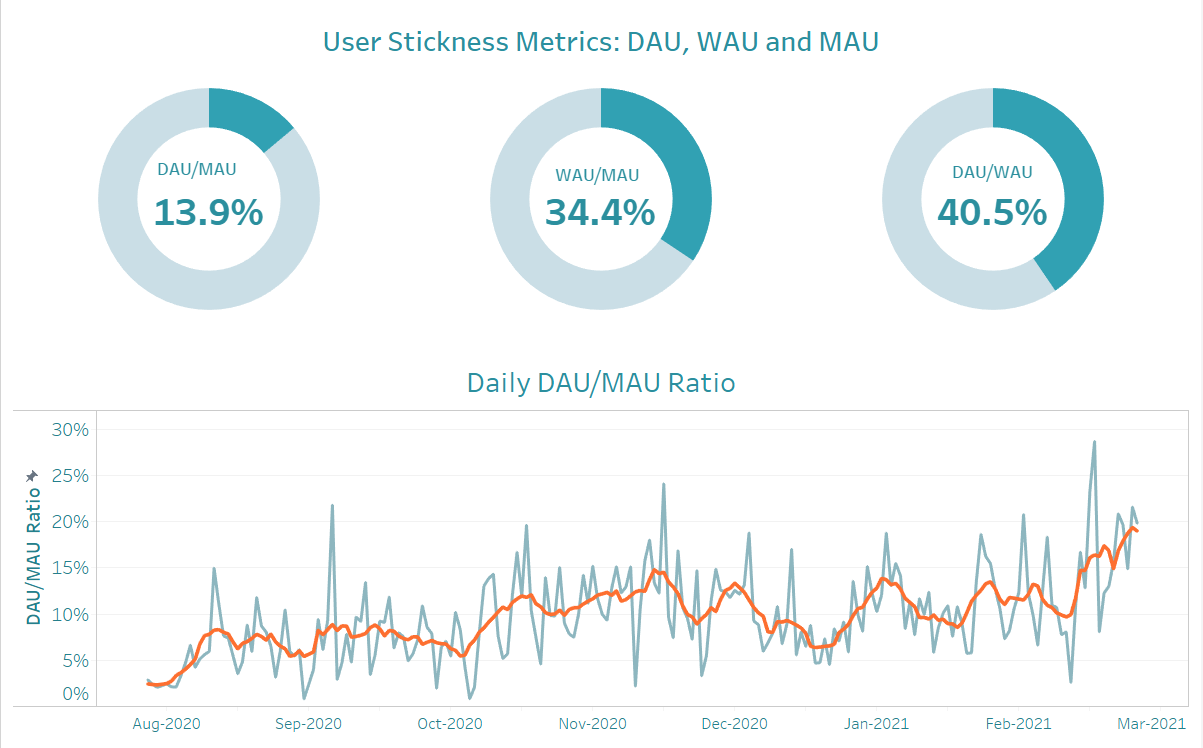
Basically, DAU/MAU is around 10% to 20% on average. Few companies can achieve 50%. However, lower DAU/MAU Ratio doesn't definitely mean that your user engagement is bad since different types of products may have different usage frequencies. People usually use social media platforms more often than video conferencing software. It makes sense that Facebook should have a higher DAU/MAU than Zoom.
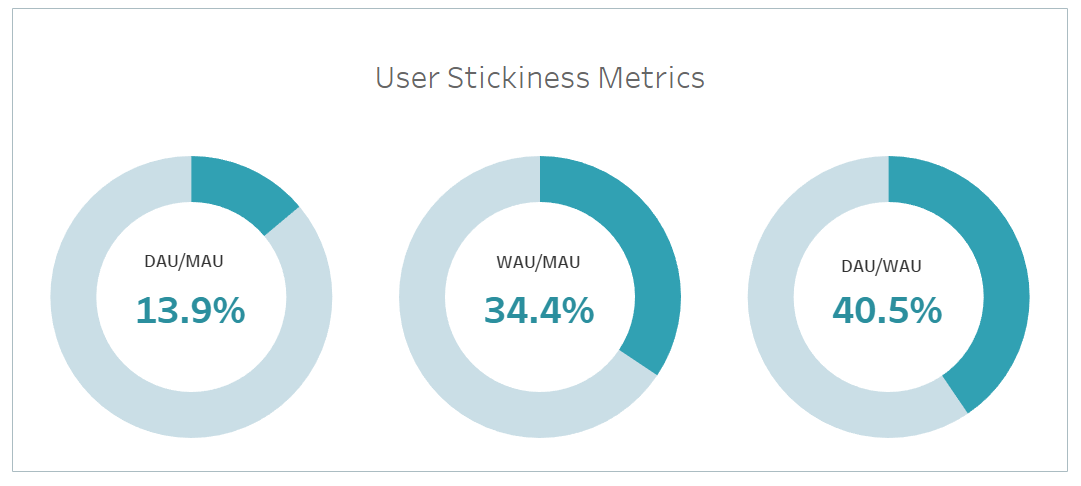
As we can see in the above graph, we calculate three ratios using different time frames of metrics and the results are totally different (WAU is Weekly Active Users.) Thus, choosing an appropriate KPI to evaluate user stickiness is important for your business in the long-term.
How to Create a Real-Time Pipeline for DAU/MAU Ratio?
Here we use a SaaS company’s user behavior data as an example. Before doing any calculation, we first need to define who our active users are. In this case, if a user logs in to the website and applies at least one action, we will consider this user as an active user.
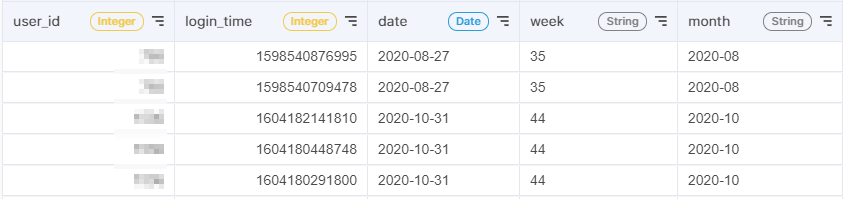
1. Transform date variables
To calculate DAU, MAU, and WAU, we need to have variables to represent the day, week, and month. Given a date column, we can use the FORMAT_DATE function in the Formulas action to return week numbers and the month. You can learn more about supported functions in our documentation.
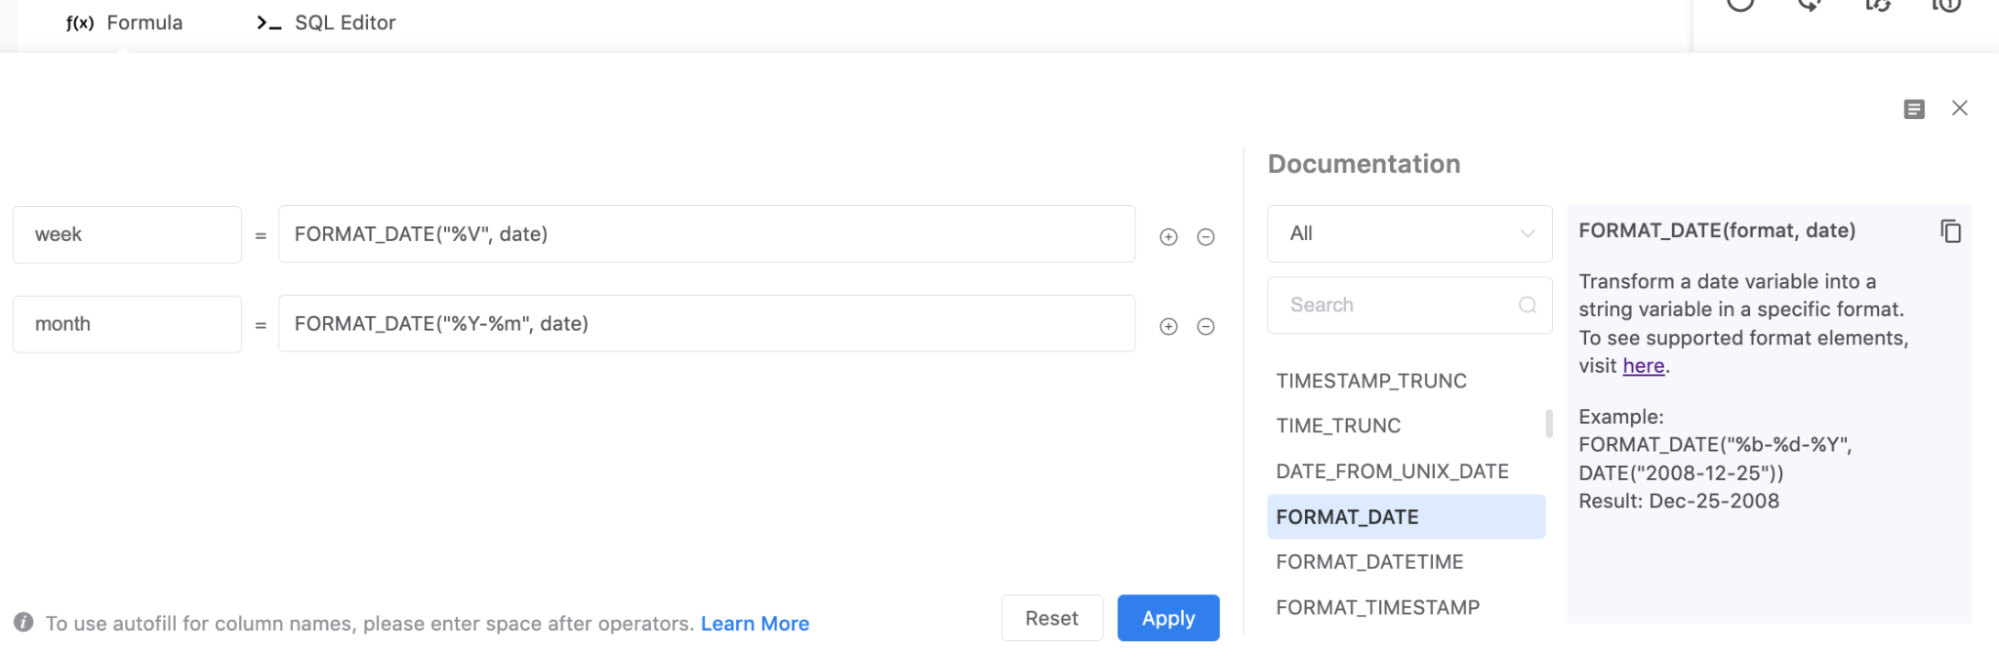
Here you are. Now we have the appropriate variables to represent days, weeks, and months.
2. Calculate DAU
To calculate DAU, WAU, and MAU, we can use the pivot table action. Pivot tables allow us to quickly summarize large amounts of data.
Make 3 copies of your table. We will use each to calculate one metric and then join the 3 tables after to calculate the ratios.
First, let’s calculate DAU. Open Pivot Tables and drag month, week, and date in Vertical Dimensions. Then, put user_id in Values and specify the aggregation as Count Distinct. This action tells the system to compute the unique number of users by date. The month and week variables will be used for joining tables later.
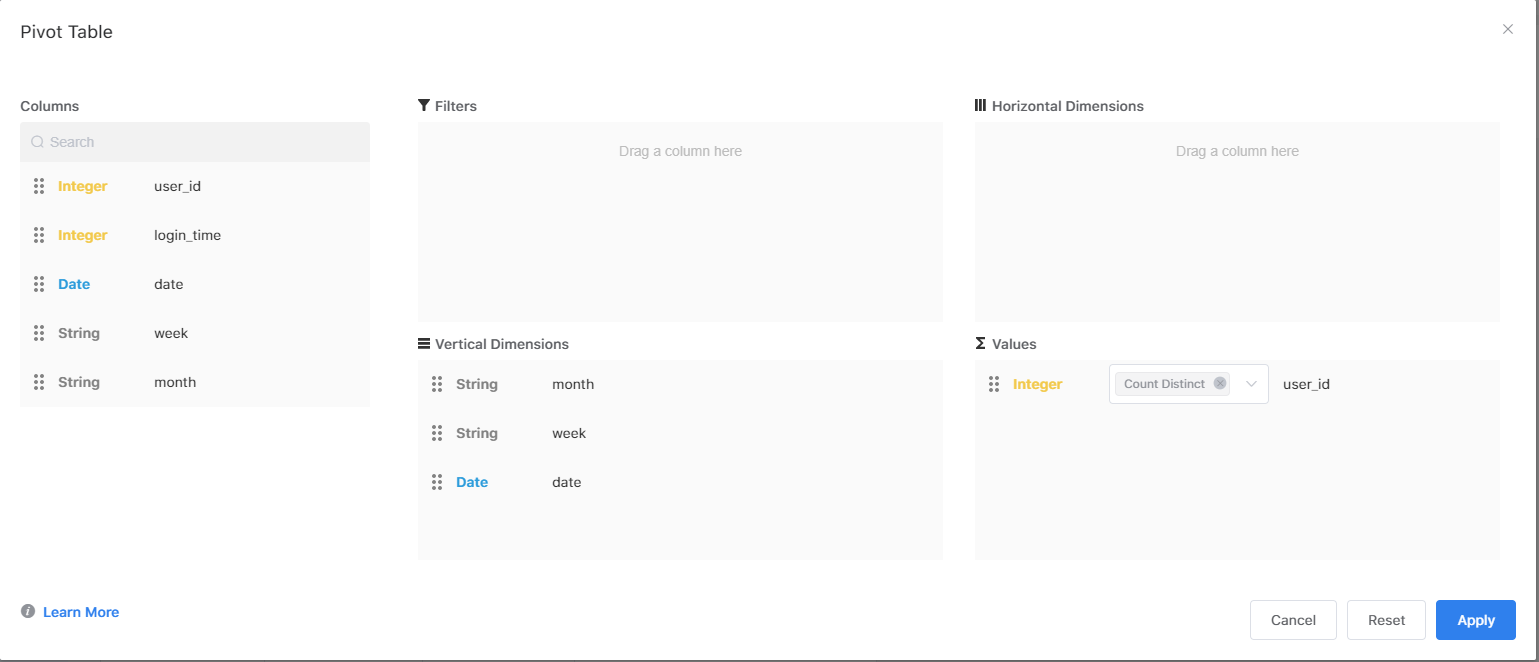
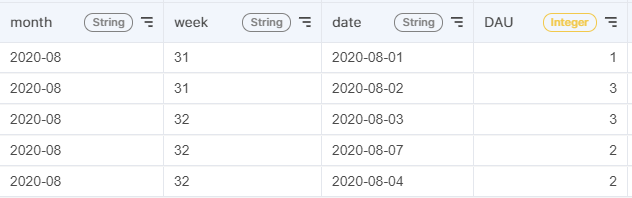
Then, rename the variable as DAU. Here is the result.
3. Calculate WAU
Head to the next copy of the table and click Pivot Tables. Place week in Vertical Dimensions and user_id in Values. By specifying the aggregation as Count Distinct, it will return the unique number of users by week.
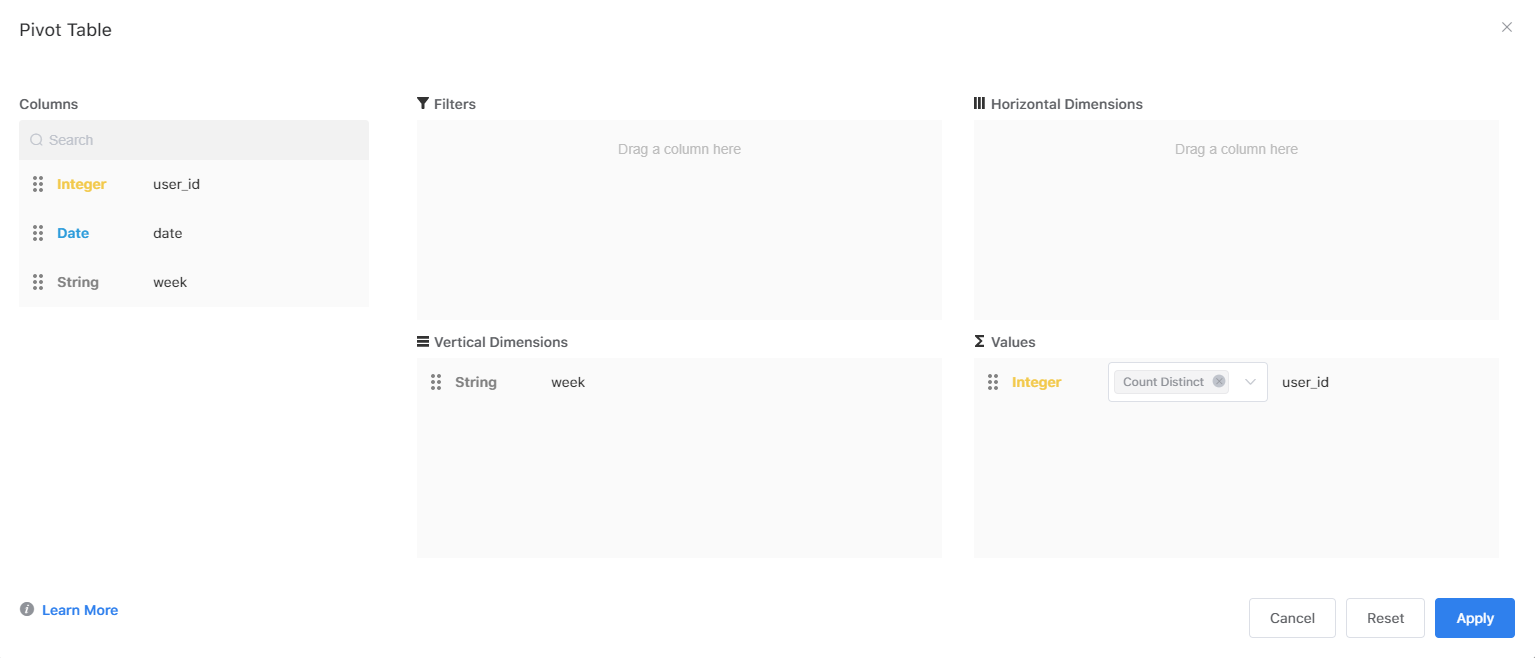
Finally, rename count_distinct_of_user_id as WAU.
4. Calculate MAU
Similar to calculating WAU, open pivot tables on the last copy of the table you made. But this time, drag month into the Vertical Dimensions and rename the new column to MAU.
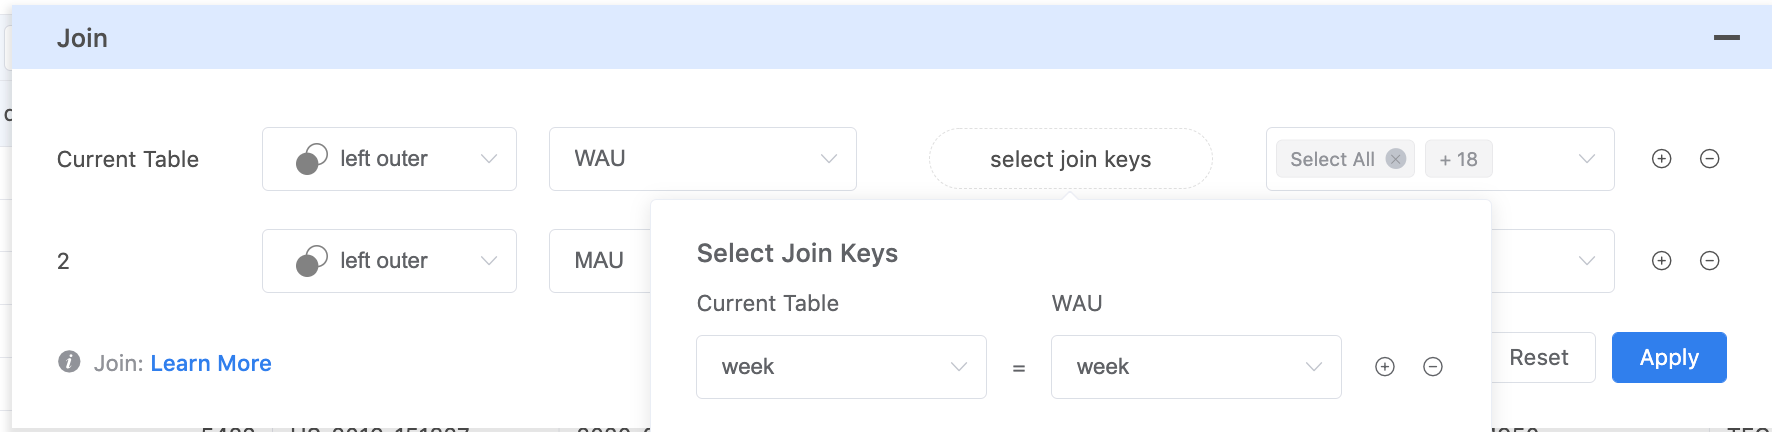
5. Join Tables
Now, you should have 3 tables, each with one calculated metric. Let's combine these tables. Go back to the DAU table and click Join. Then, merge the DAU and WAU table based on the week column.
Similarly, join the DAU and MAU table based on the month column.
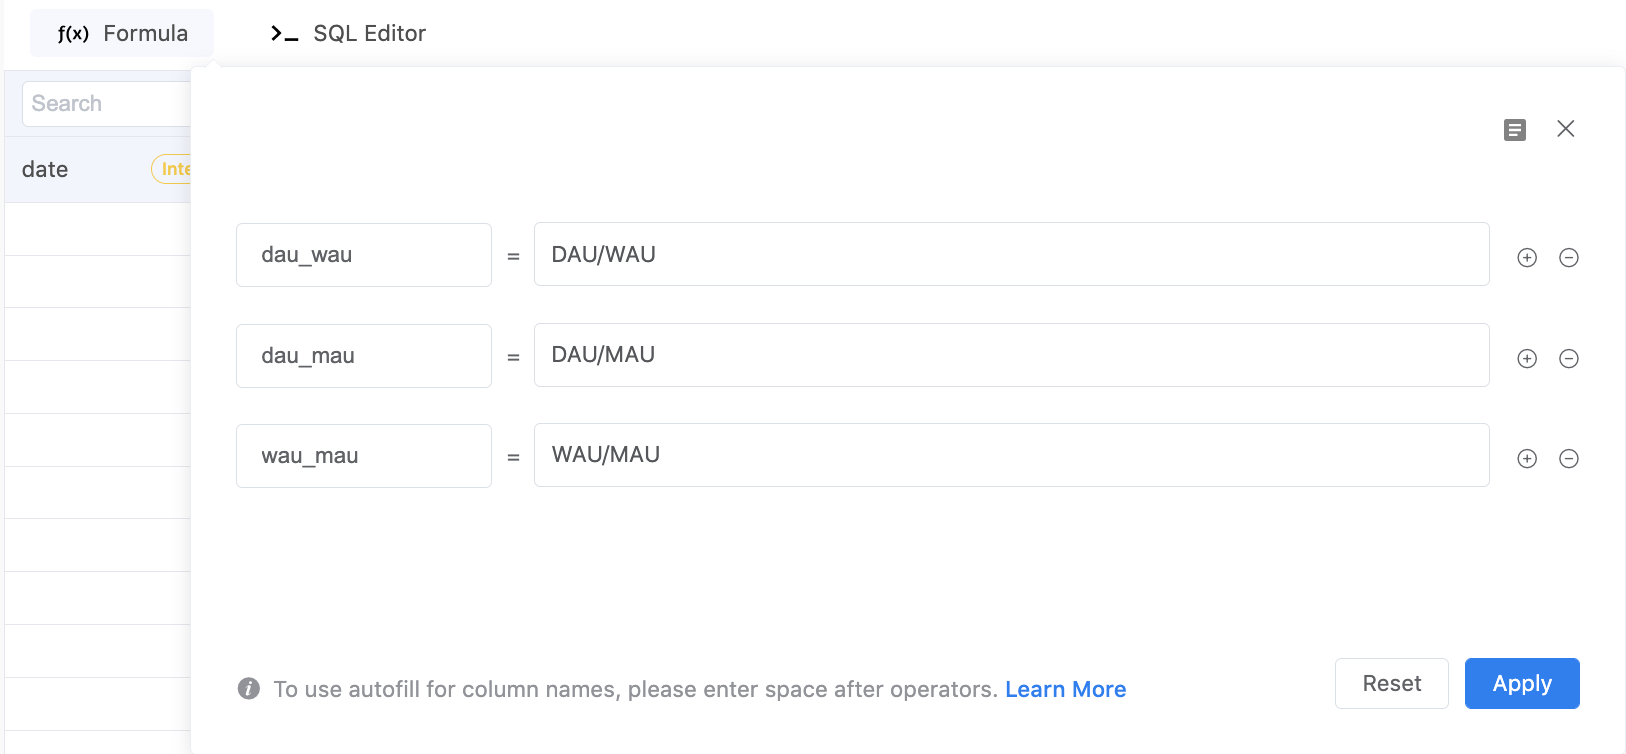
6. Calculate Ratios
Now, click Formula to calculate user stickiness metrics. Here, we demonstrate how to calculate three kinds of ratios. In reality, you don't have to calculate these three metrics. You just need to choose one of them as KPI to evaluate user stickiness.
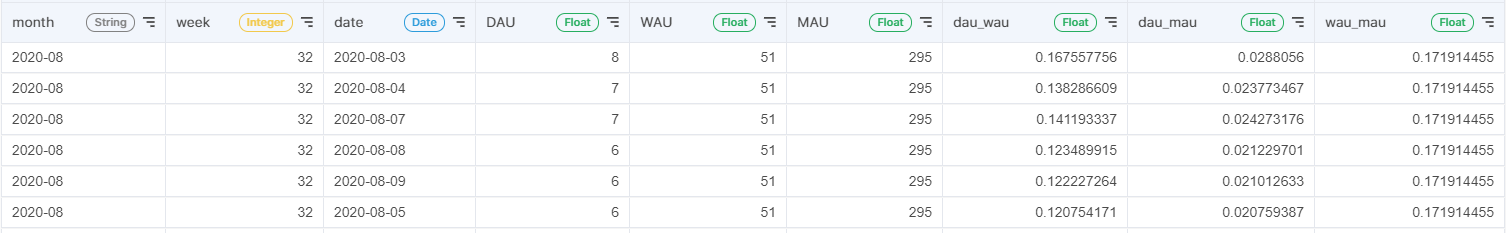
Here are the final results.
7. Visualize the results
The last step is to produce a chart with your table. You can make charts through Acho’s Charting App. You can also connect your Acho table to your favorite BI tools such as Tableau and Metabase.

Finally, if you want to create a real-time dashboard to update numbers automatically, you can check out this article to set up Data Sync.