Data preparation involves manipulating and pre-processing raw data into an analytics-ready form. It is the first step for data analytics projects. It can include many discrete tasks such as data wrangling, data ingestion, data mapping, data aggregation, data fusion, data matching, data cleaning, data augmentation, and data delivery.
What are some of the examples?
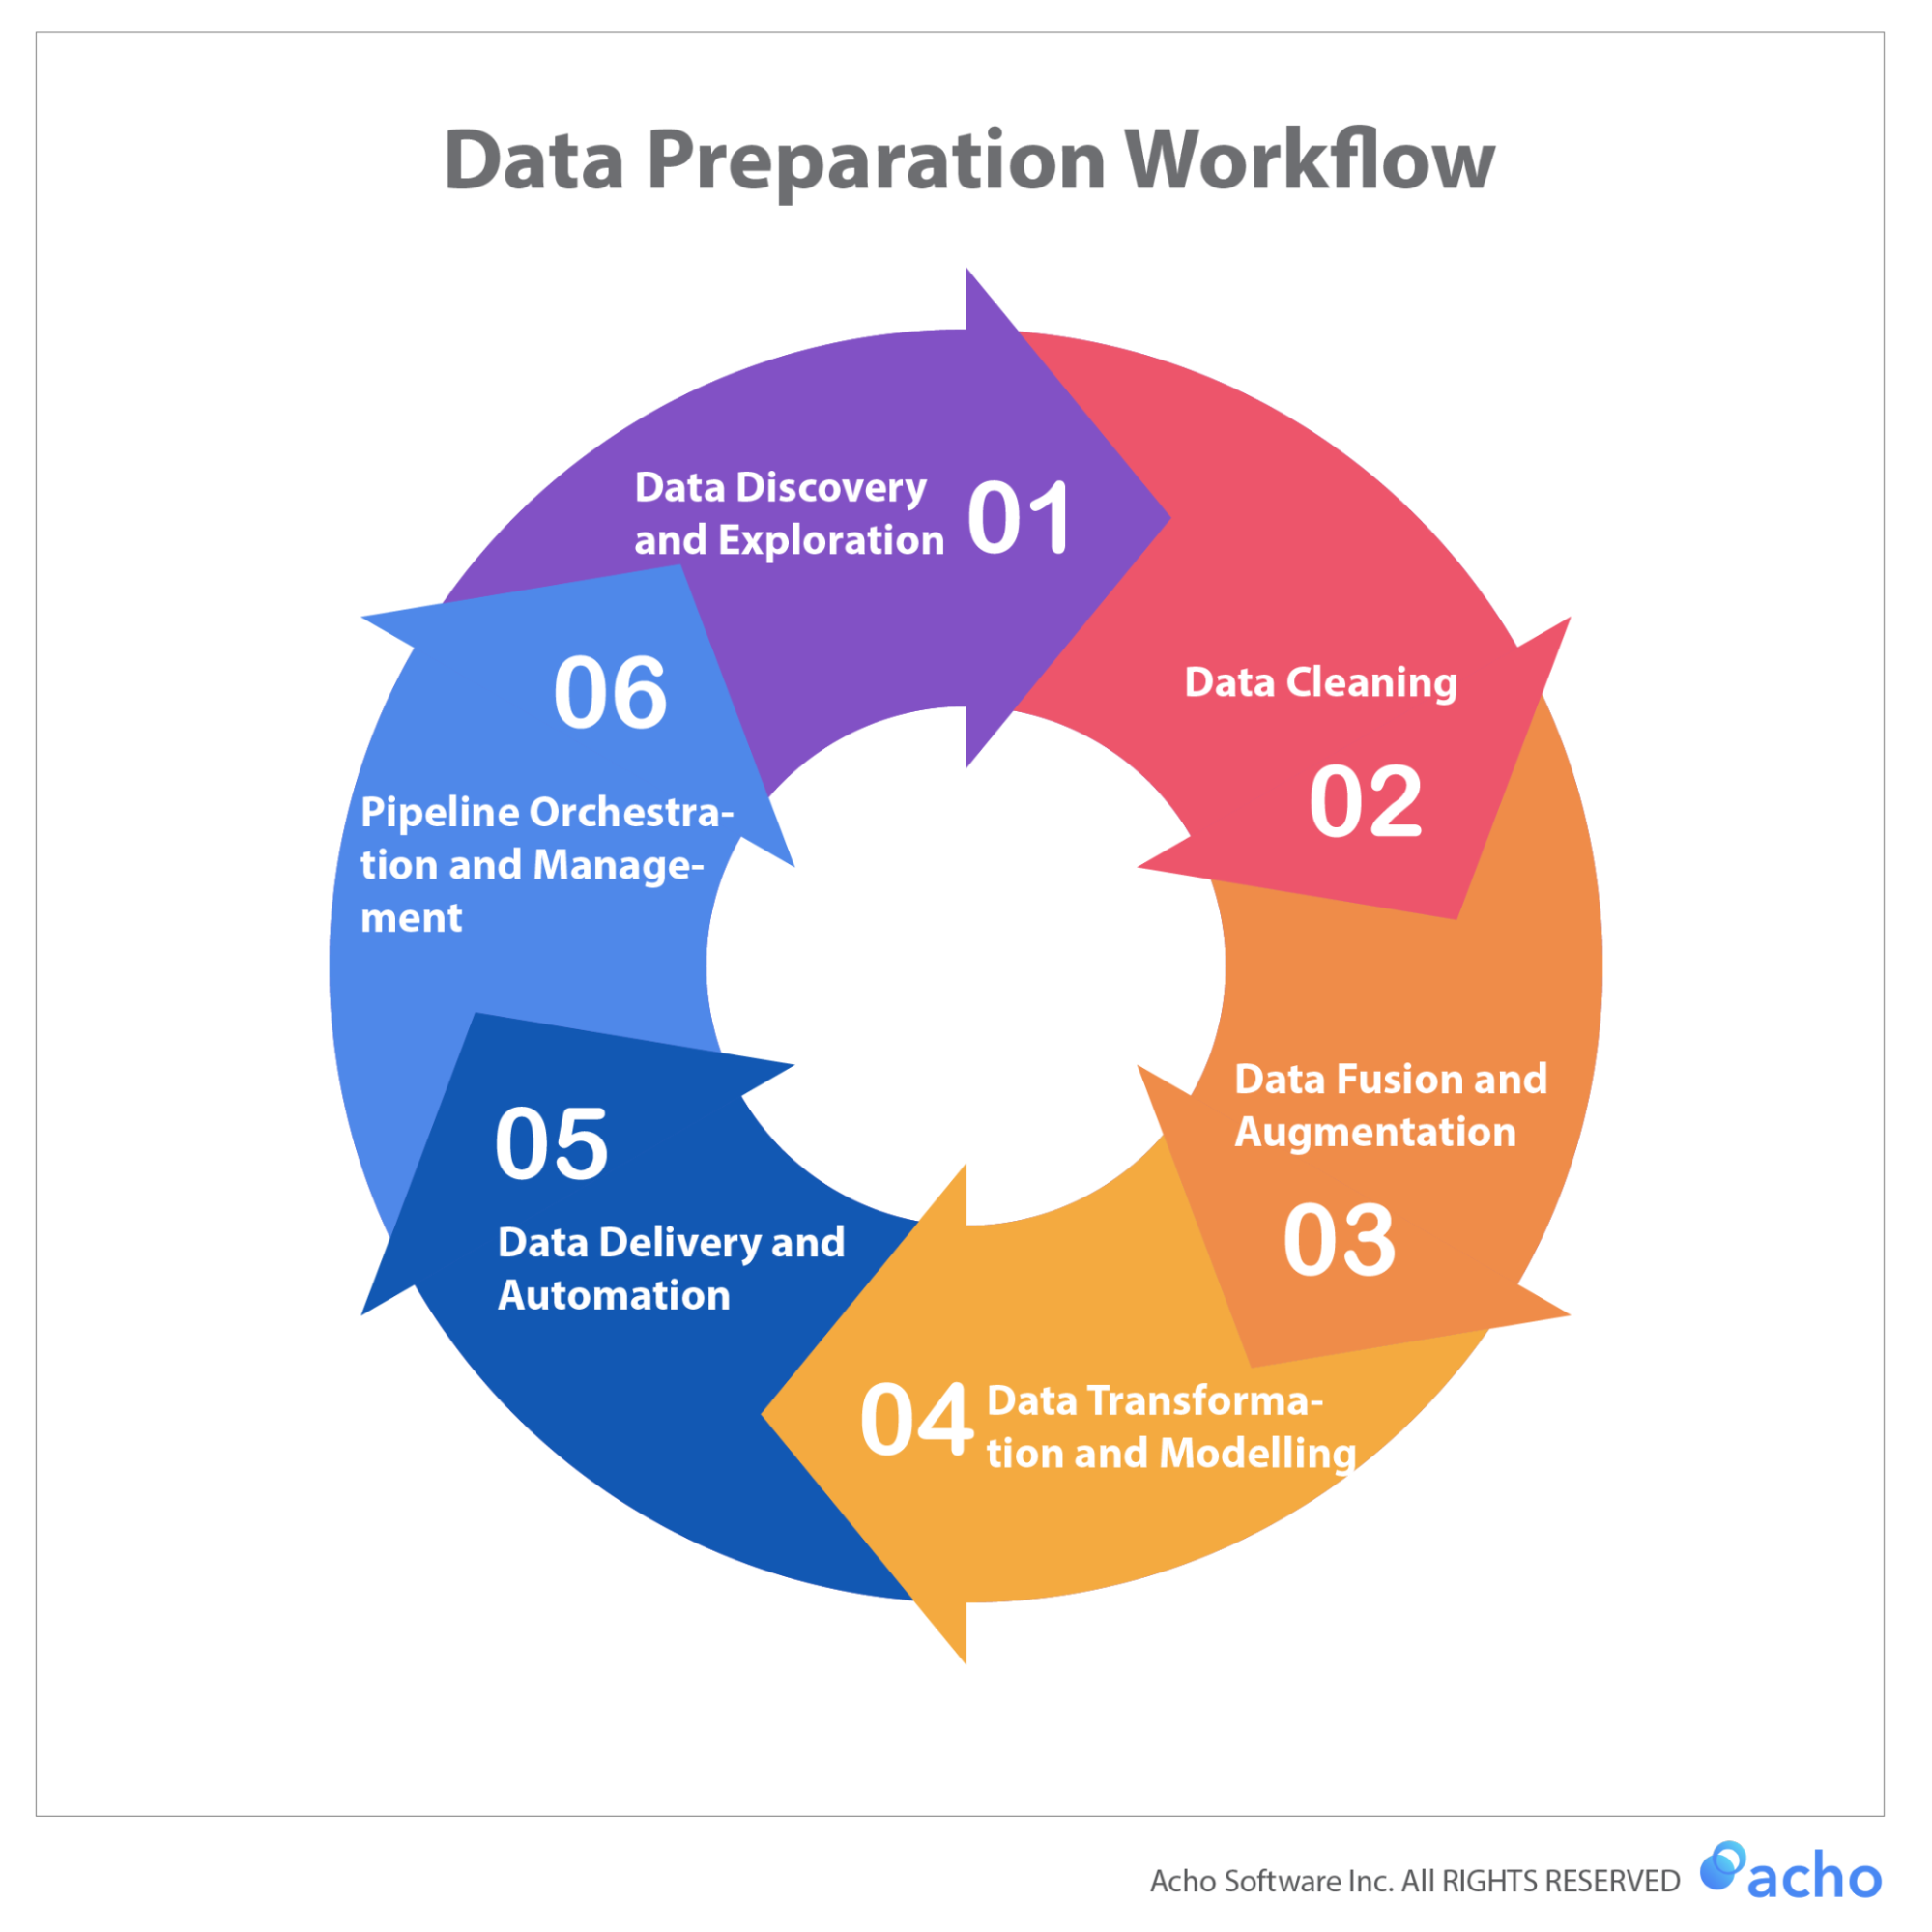
As the chart illustrates, data preparation is really a circular process where each step feeds into the succeeding step. Data Discovery for example typically leads to Data Cleaning and Data Fusion. It will also provoke new needs and requirements for Data Delivery and Pipeline Management. Imagine a COO reading an analytical dashboard for inventory management. They may require new data points to be reported. This would require the analysts and engineers responsible to go through the Data Preparation Workflow and add new data points to the dashboard.
What are some of the challenges?
Data is too large
When it comes to preparing data, we often run into issues with large data coming from disparate sources. Whether it’s a large flat CSV file or database from a CRM system, it’d often take up a lot of computational resources to clean, combine, and transform the data into the form needed.
The best solutions for dealing with large datasets are to make sure that
- extraneous data and outliers are removed
- missing values and data points are filled
- data is compliant with a standardized pattern
When the dataset is narrowed down to only the records needed, it would become much easier to work with for future steps.
The “Joinability” Issue
Another critical issue with data preparation is finding relationships between tables. A well-maintained database typically has a network of tables with pre-existing relationships and well-designed schemas that support these relationships. For example, user ID, product ID, locations, and timestamps across these tables should comply with a unified standard so they’re ready for retrieval or analytics.
However, this is typically not the case, especially since data are coming from different sources. The best solutions for joining disparate data sources are to make sure that,
- “Join Keys” are unified across different tables
- all available tables are well-understood for corresponding business needs
- data is replicated outside of the data sources so wrongful joins can always be reverted
Joining tables from different sources is often more experimental than standardized, though it’s often useful to understand the goal beforehand.
Data Integrity Issues
In any database, individual errors can affect a small number of data records. Whether due to errors in the original data entry or technical errors for data in transit, they may cause the end results to be questionable for the business stakeholders. To address Data Integrity issues during the data preparation process, it’s very helpful to
- check in with the teammates responsible so data is approved before it is processed
- leave notes and annotate certain data points so doubts can be addressed and resolved later on
- compare with existing reports and find inconsistencies and possible integrity issues
Why do BI dashboards require data preparation?
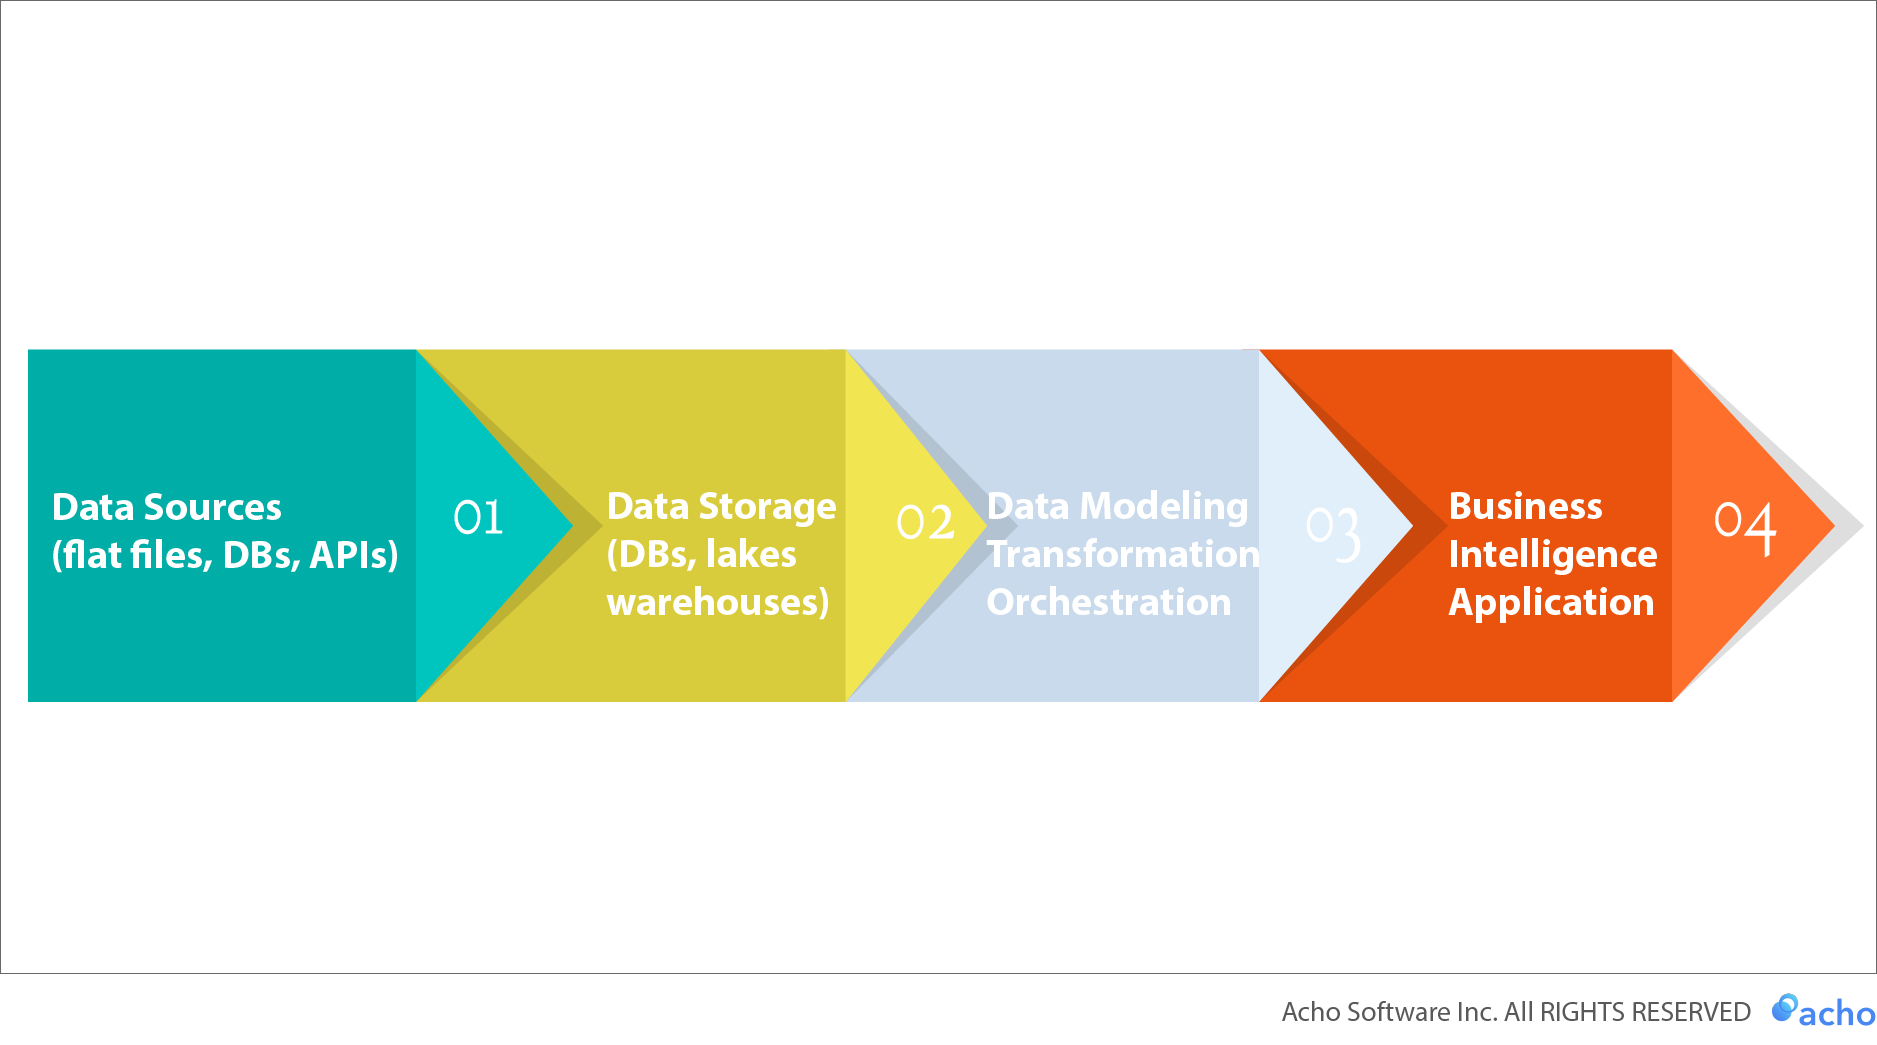
Modern BI dashboards can “talk” to relational databases directly. This means that they are great for retrieving readily available data and visualizing it for consumers. However, raw data requires data preparation as we discussed. Even though data can be processed and prepared within a data warehouse or lake, it’s useful to have a “semantic layer” that replicates and indexes existing data from the warehouse for supporting BI applications. The below illustration shows how the workflow can function as a well-managed pipeline for supporting BI applications.
How to prepare data for a BI dashboard?
In this article, we’ll use a digital marketing dashboard as an example to demonstrate how to preprocess your data on Acho.
Collect data from its sources
Generally, digital marketers use multiple different tools to implement marketing campaigns. For example, they may run advertising campaigns on various platforms, such as Google, Facebook, or Instagram. To build a dashboard to track KPIs across these platforms, we should consolidate data from these sources in a single place first.
In this case, we want to build a marketing KPI tracking dashboard from these sources:
- Google Ads
- Facebook Marketing
- Bing Ads
- Instagram Ads
- Youtube Analytics
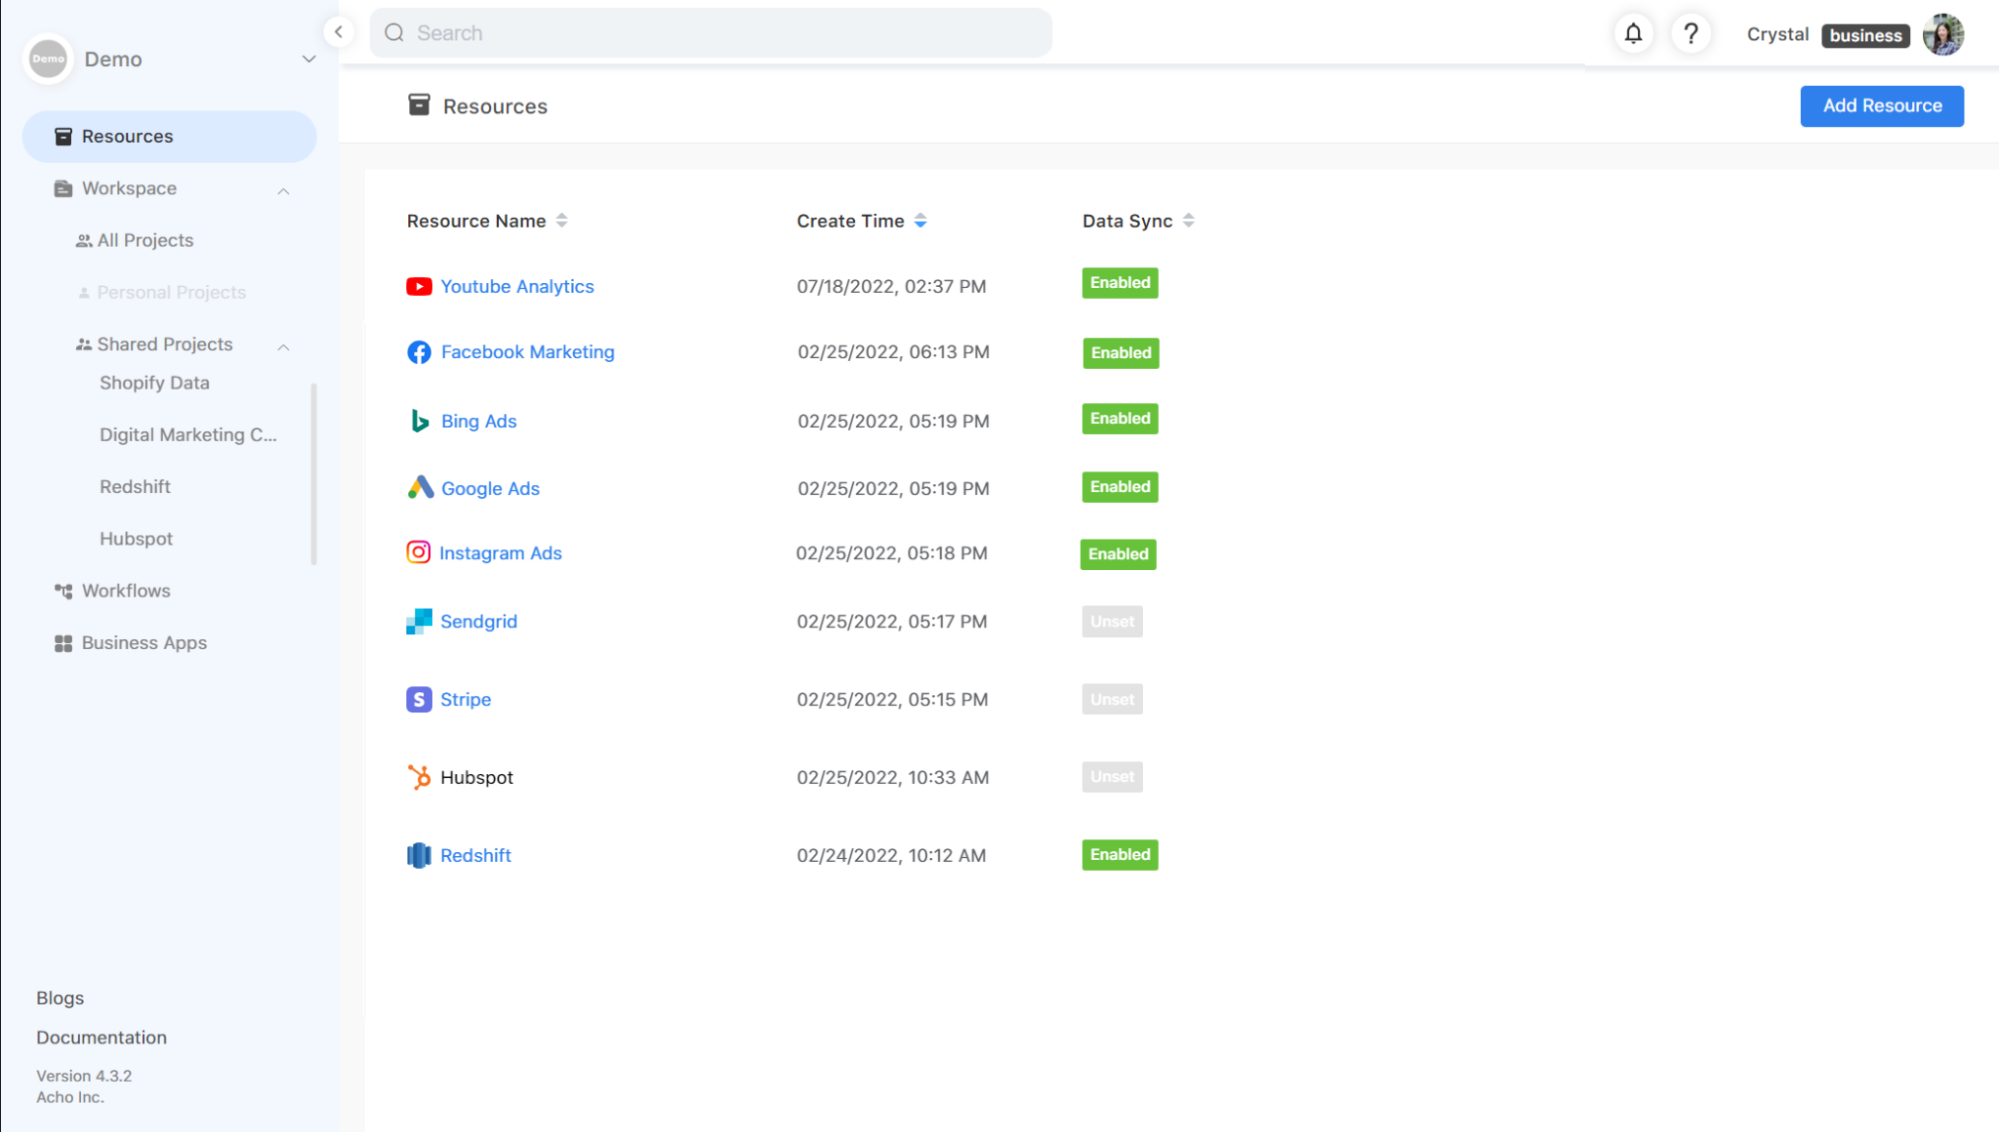
On Acho, you can add a resource on the Resource page and follow the instructions to connect the data source. Once the connection is set up successfully, you may need to wait for several minutes to retrieve data.
Clean and transform data
This step is the most important part of data preparation. Good data transformation can help analysts save lots of time on reporting. They won’t have to waste time cleaning and transforming data every time they want to analyze it. Here are some guidelines for you to prepare data much easier.
1. Clean data
Messy data decreases the quality of your analysis. You can check out if your data have the following issues and fix them before you start analyzing your data. Here are some common issues that you should pay attention to:
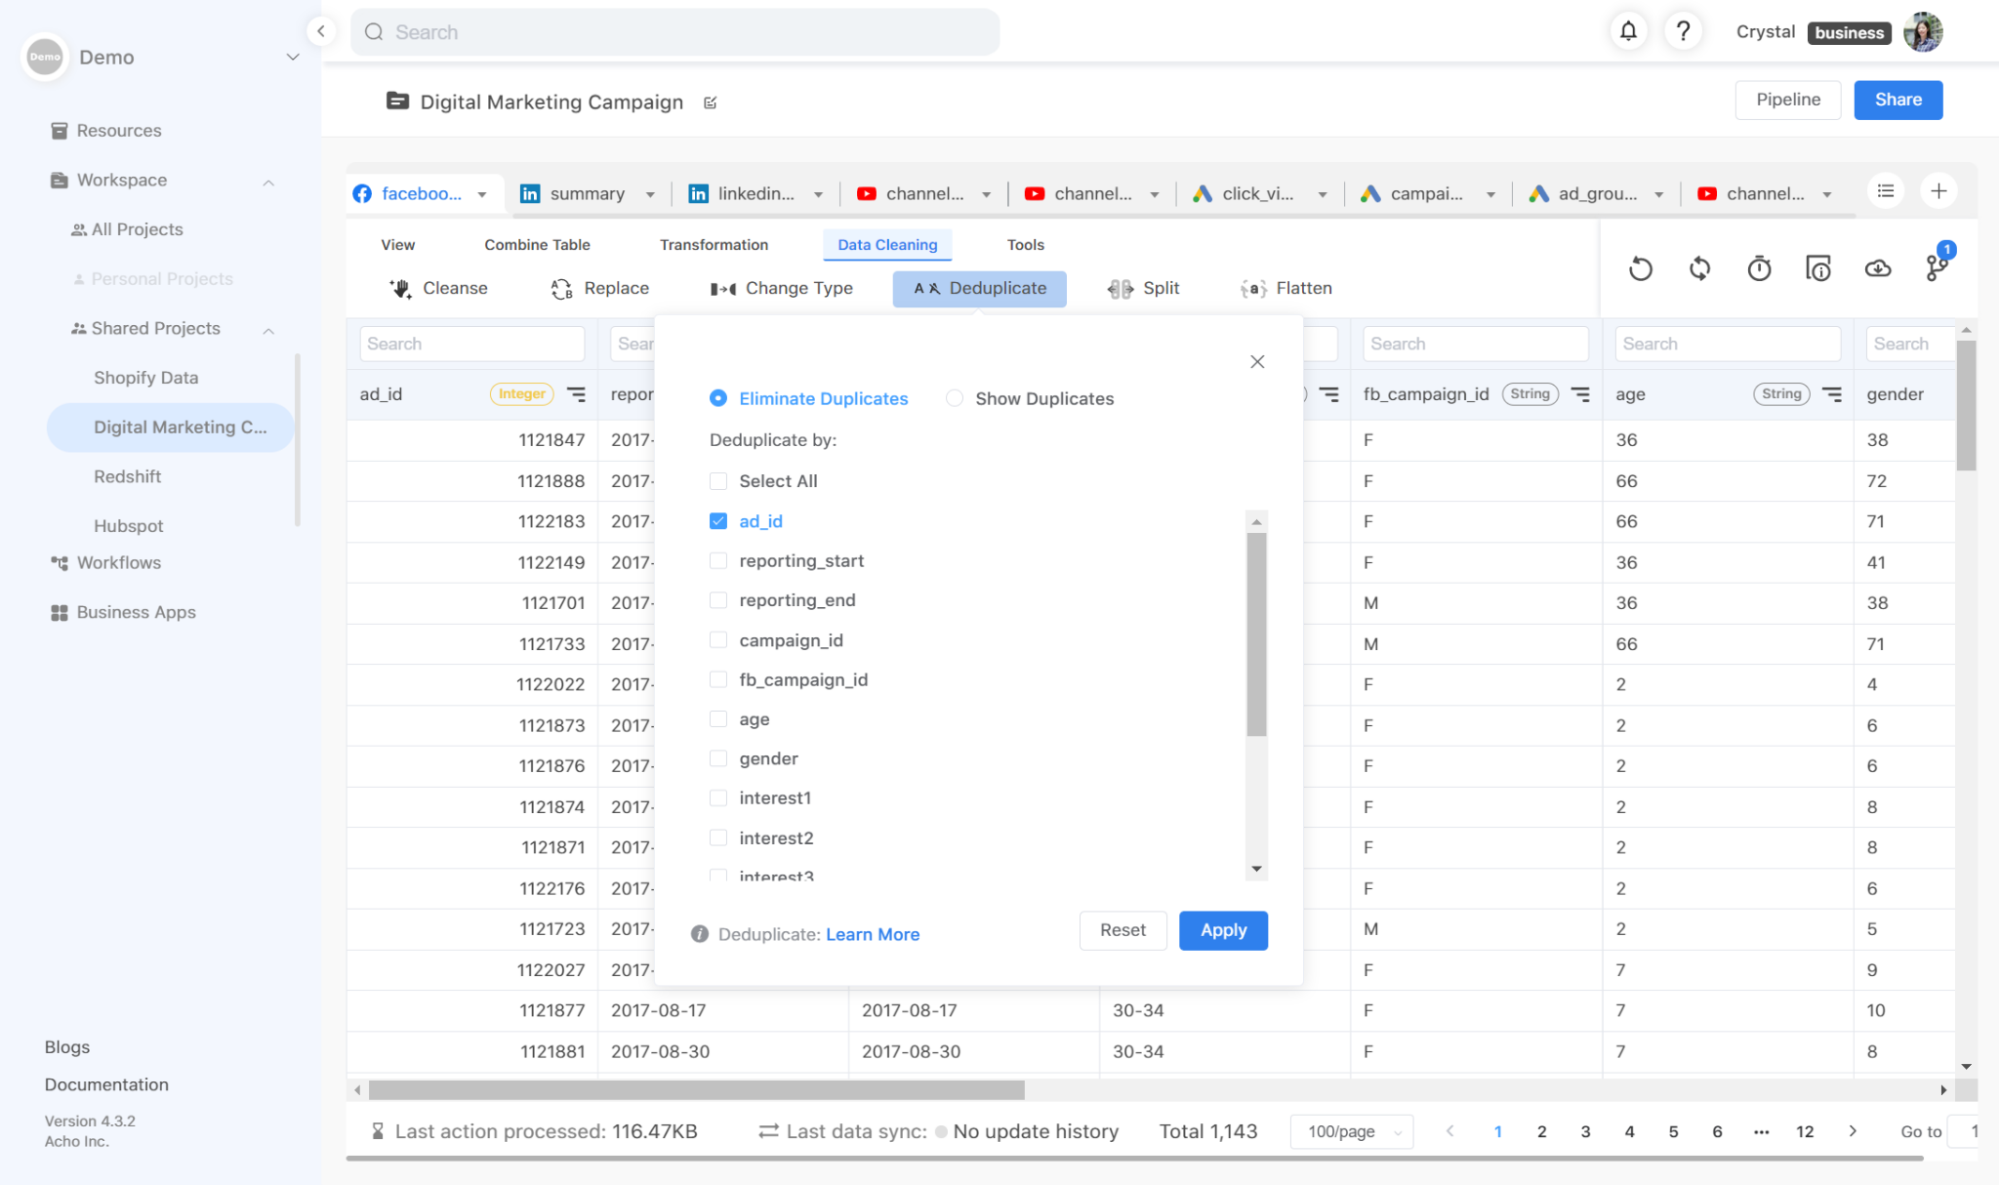
- Duplicated data
Duplicated data means some of the rows in your table are exactly the same. This issue causes your analysis to be inaccurate.
- Irrelevant data
Irrelevant data is the data that is nothing related to your problem or is not useful in analyses. For example, some tables may contain the table’s metadata, such as the table size, the number of rows, or the last updated time. These fields may not be helpful for your analysis.
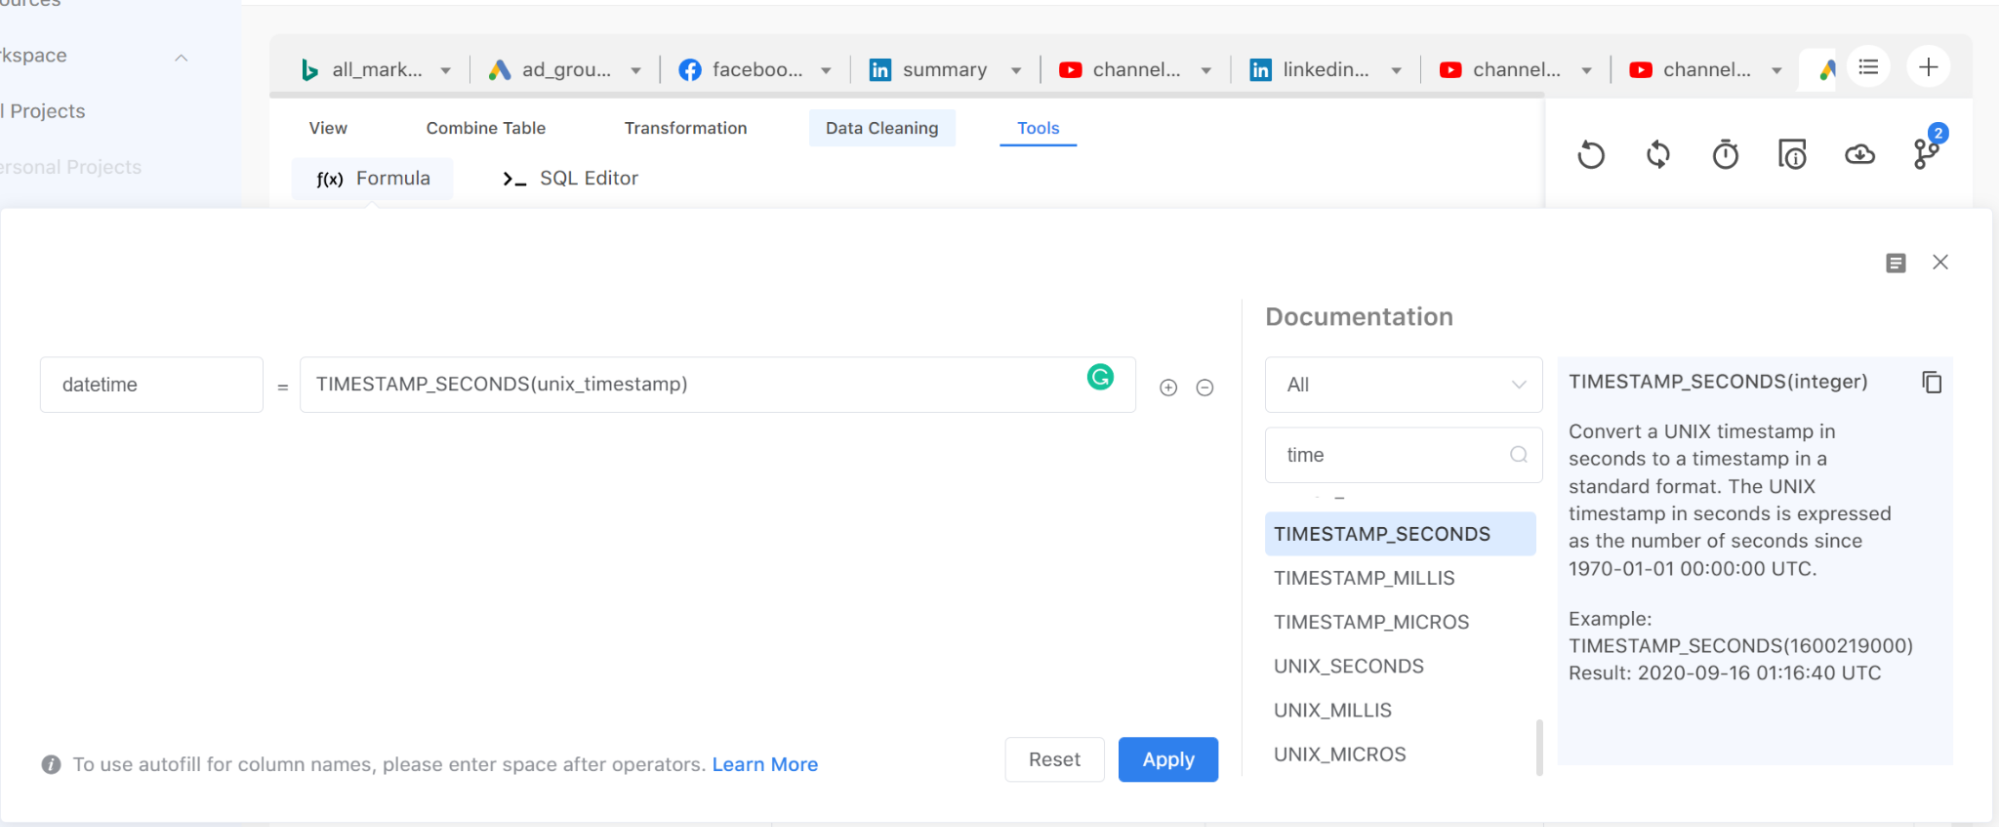
- Inappropriate data type or format
Typically, BI tools can detect the data type of each data field automatically. However, if a data field is displayed in an inappropriate format, it might be difficult to analyze.
For example, if a date and time column is displayed in a UNIX timestamp, such as “1658435238”, you should turn it into a human-readable format, such as “2022-07-21 20:27:02”. In this case, you can use the “Formula” action to change the display format.
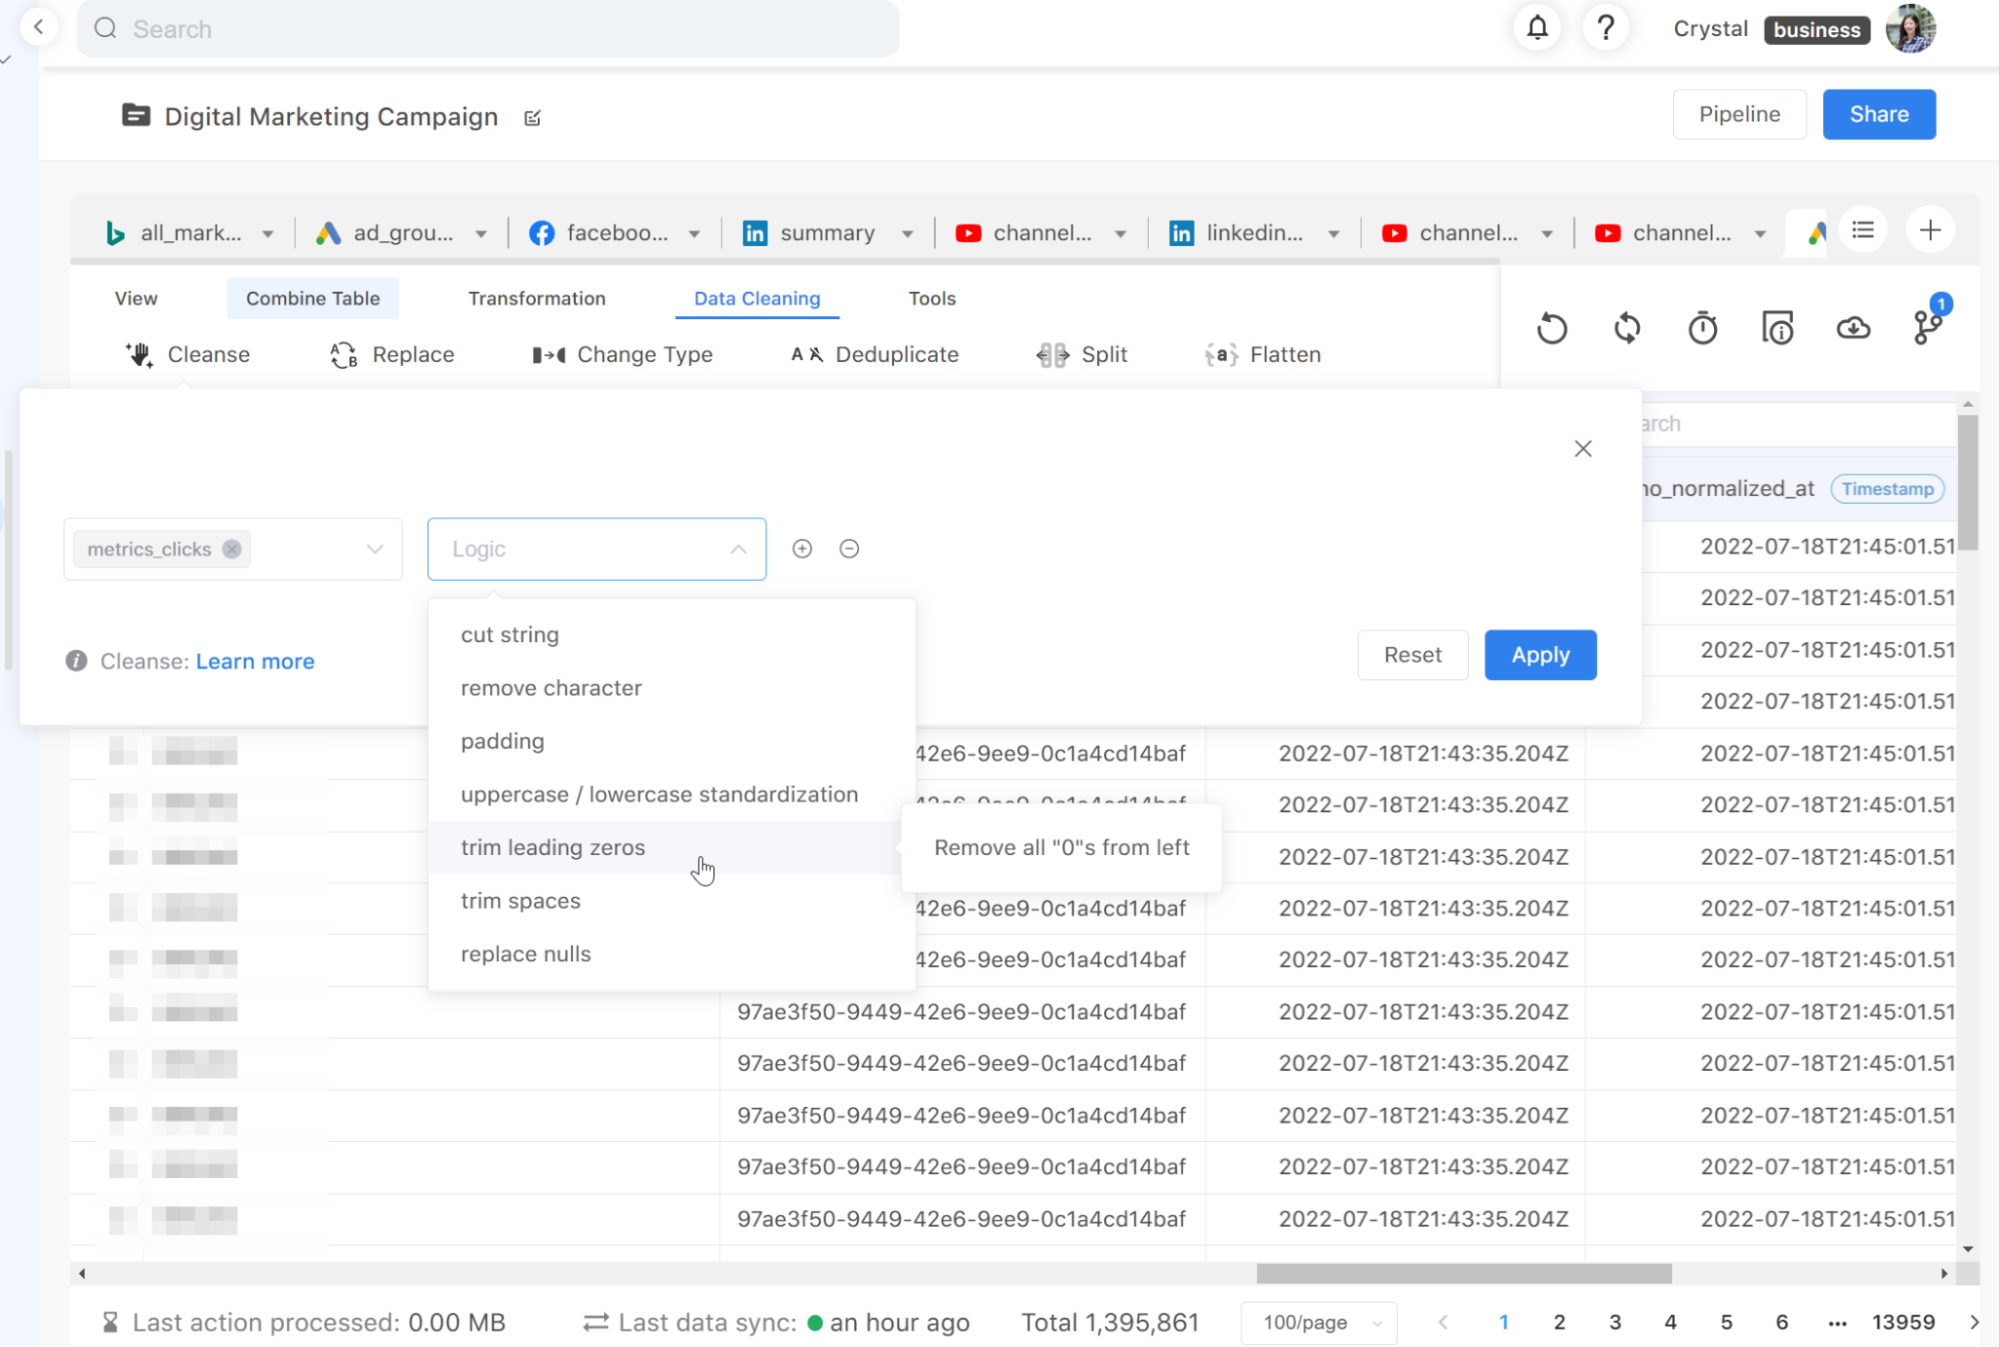
- Syntax errors
Syntax errors happen when your data has some misleading characters. Your analysis or report may have some biases if syntax errors are not dealt with carefully. Here are some common syntax errors:
- Typos
- Redundant spaces or characters. For example, “ Apple” has some unnecessary spaces..
- A lack of leading 0s (especially in zip codes)
- Missing values
Missing values happen due to two reasons. One is that there are some errors in your pipeline or data sources so that data is not parsed correctly. In this case, you have to examine the entire pipeline and make sure everything runs correctly.
The other situation is that some records don’t have that information. You can choose to leave missing values as “null” or impute missing values as a specific value, such as an empty string (“”), or 0 (depending on the data types.)
On Acho, syntax errors and missing values can be solved by applying the “Cleanse” action or writing SQL in “SQL Editor”.
2. Combine tables
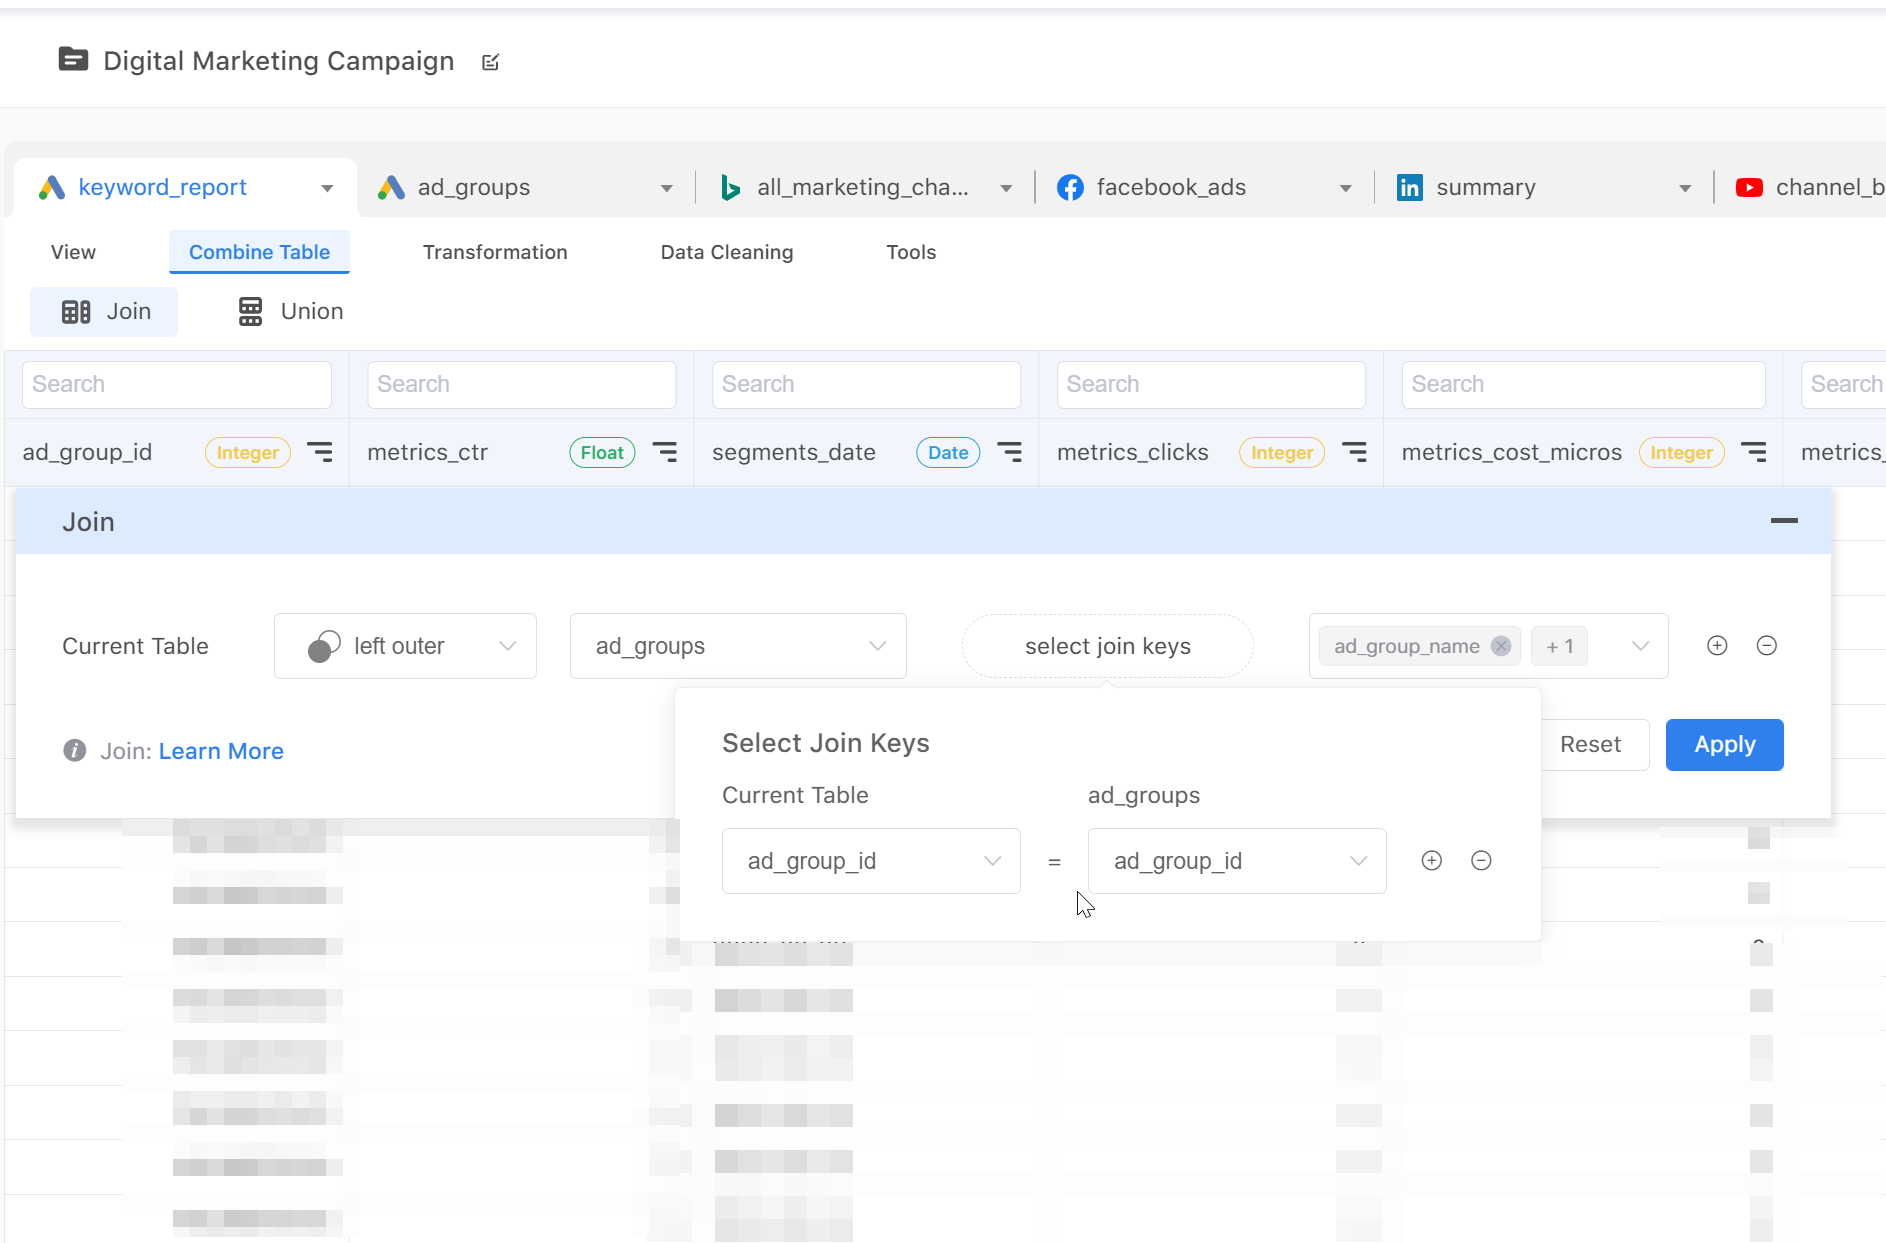
- Make your table have sufficient information
Generally, to optimize storage efficiency, data is normalized into several tables and stored in relational tables. That is, you have to combine multiple tables to get complete information. In the following example, the “keyword_report” table in Google Ads has a “ad_group_id” column, which allows you to identify which records belong to which Ad group. However, you don’t know what these groups are. Thus, you have to join the “ad_groups” table to get each Ad group’s name.
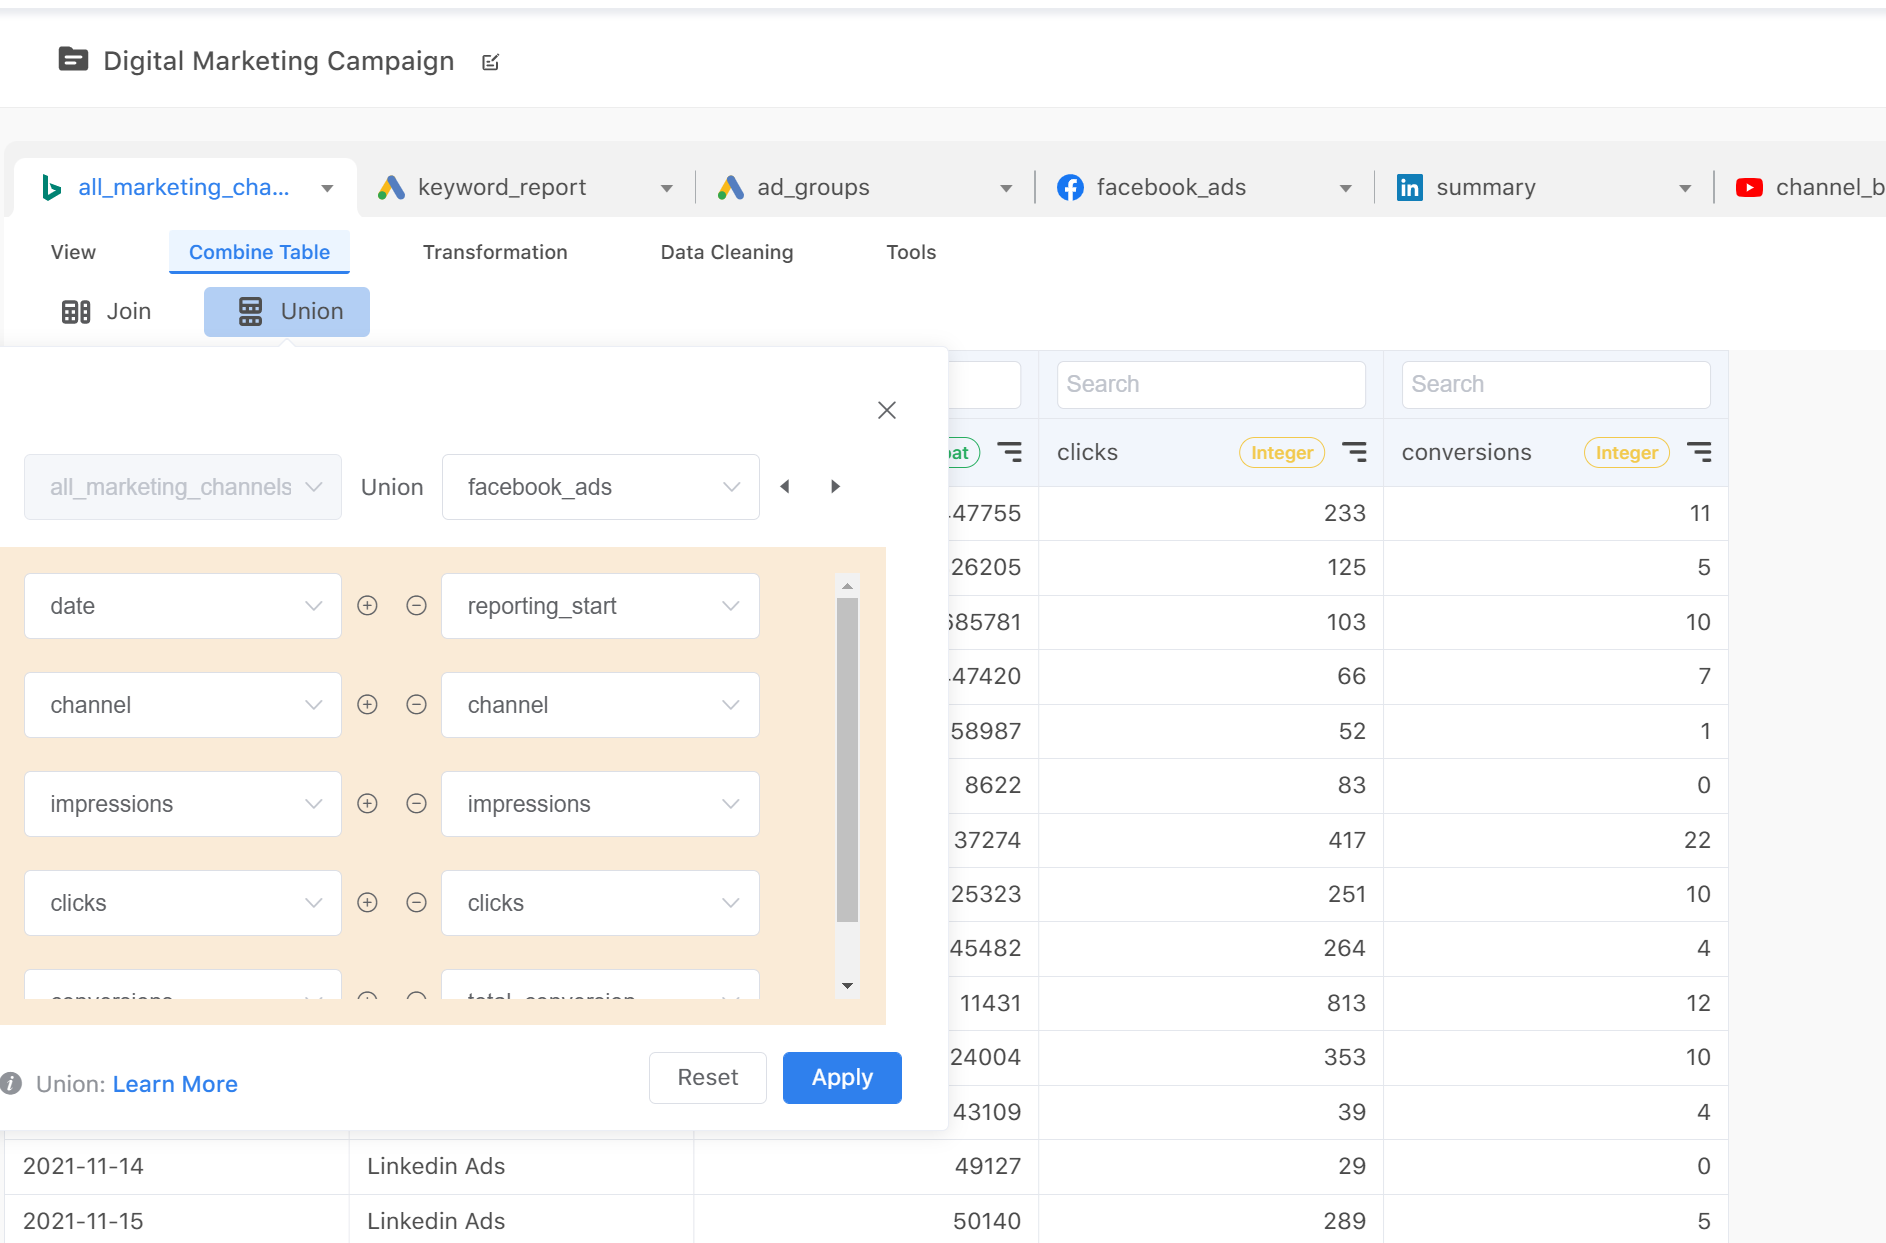
- Consolidate data from different sources
Another situation is that your data comes from different data sources but has similar information. In our case, we run multiple marketing campaigns on different platforms, and all of these platforms share similar data fields, such as clicks, impressions, or conversions. Combining these tables into a single table can help us to compare the performances of different channels in BI tools
3. Shrink your tables
BI tools are not good at processing large amounts of data, so it’s better to make your table smaller before loading it to your BI tools. For example, in this case, all metrics are recorded on a daily basis. You can further aggregate data by month to decrease the number of records.
However, you have to make sure of the granularity of the data you need for your analysis. If the granularity of your data is not useful for various analyses, you have to adjust your transformed table constantly. It will lose the meaning of data preparation.
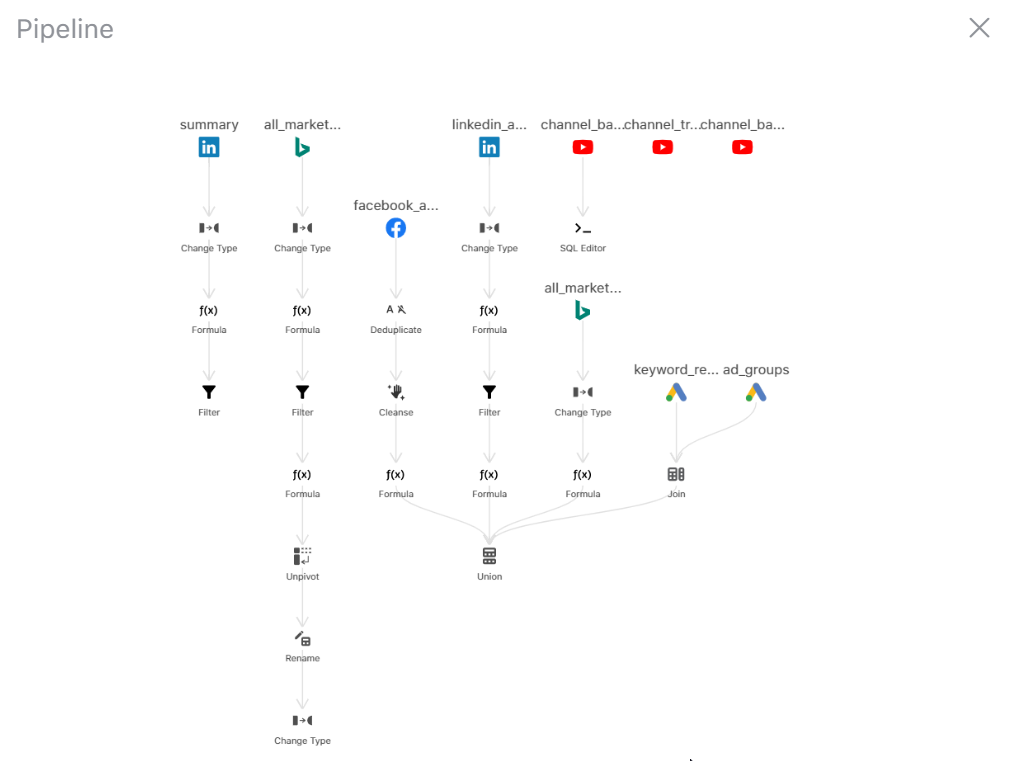
4. Examine your data pipelines
After finishing data cleaning and transformation, you should check all actions you applied by clicking the “Pipeline” button. Pipelines present the transformation history and the relationships between tables in a network diagram. This can help you avoid applying repeated actions or forgetting to combine some of the tables together. Also, when some errors happen, it’s useful to debug or find out the issues in the pipelines.
Connect transformed data with BI dashboards
Once all your data is ready, you can start exporting them to a BI tool. You can go to the table you want to export and click the “export” button on the toolbar. Then, it will bring you to Workflow.
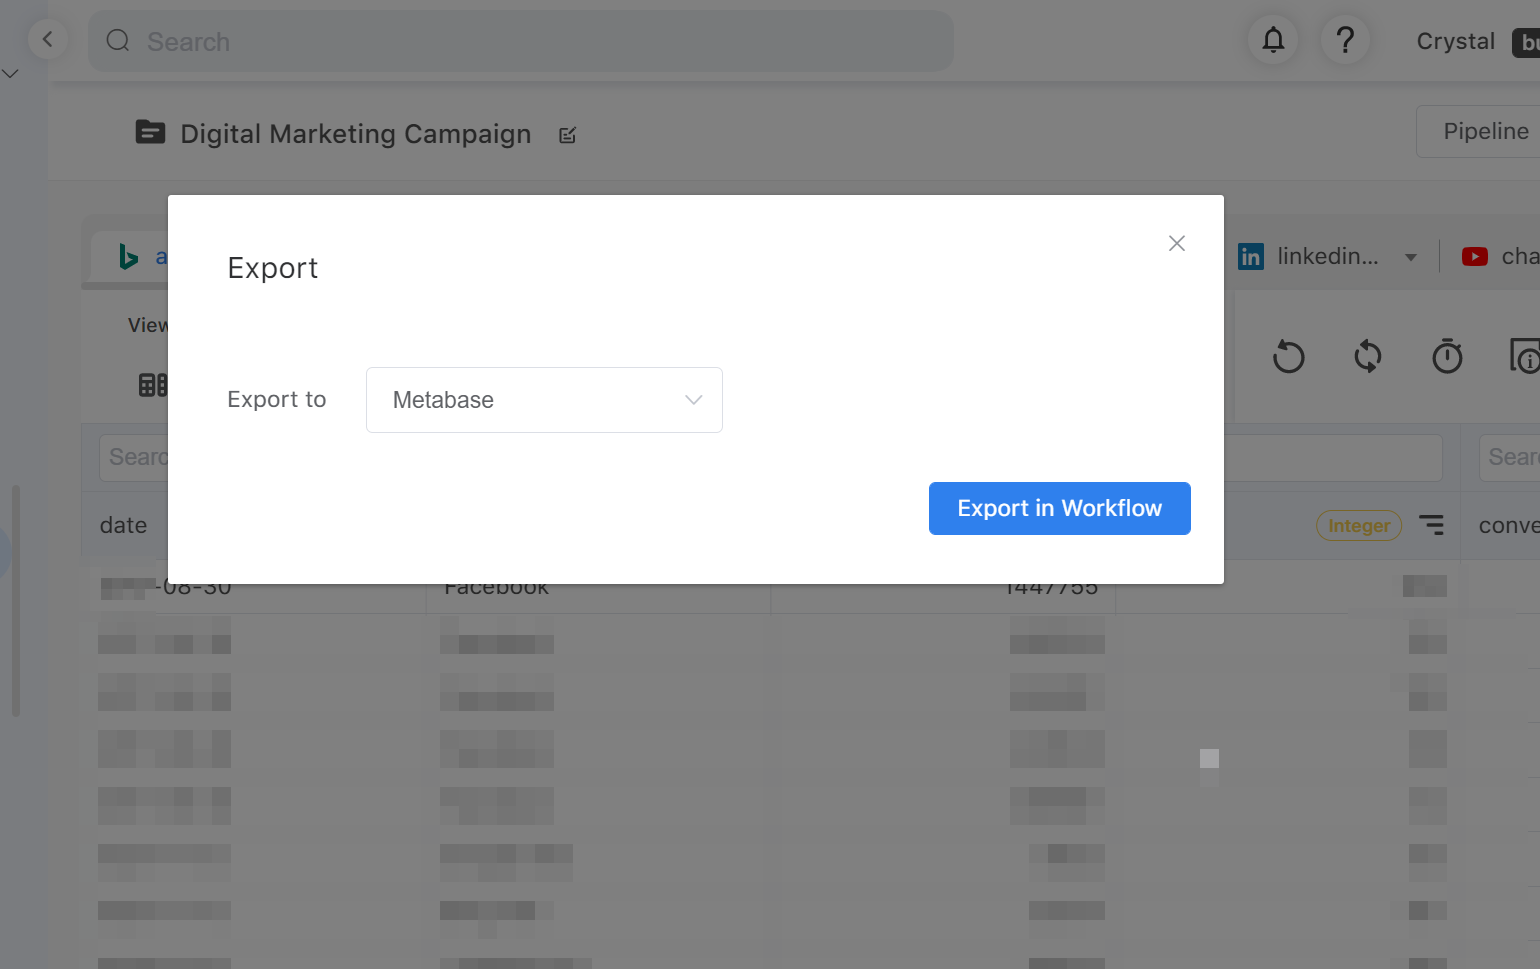
In Workflow, you can send data to other BI tools by dragging a BI tool node to the canvas and linking the table to the node. If it’s your first time exporting data to a BI tool, you have to follow instructions to set up a connection in your BI tool. Once the connection is set up, some BI tools (such as Metabase) can retrieve data from Acho tables automatically.
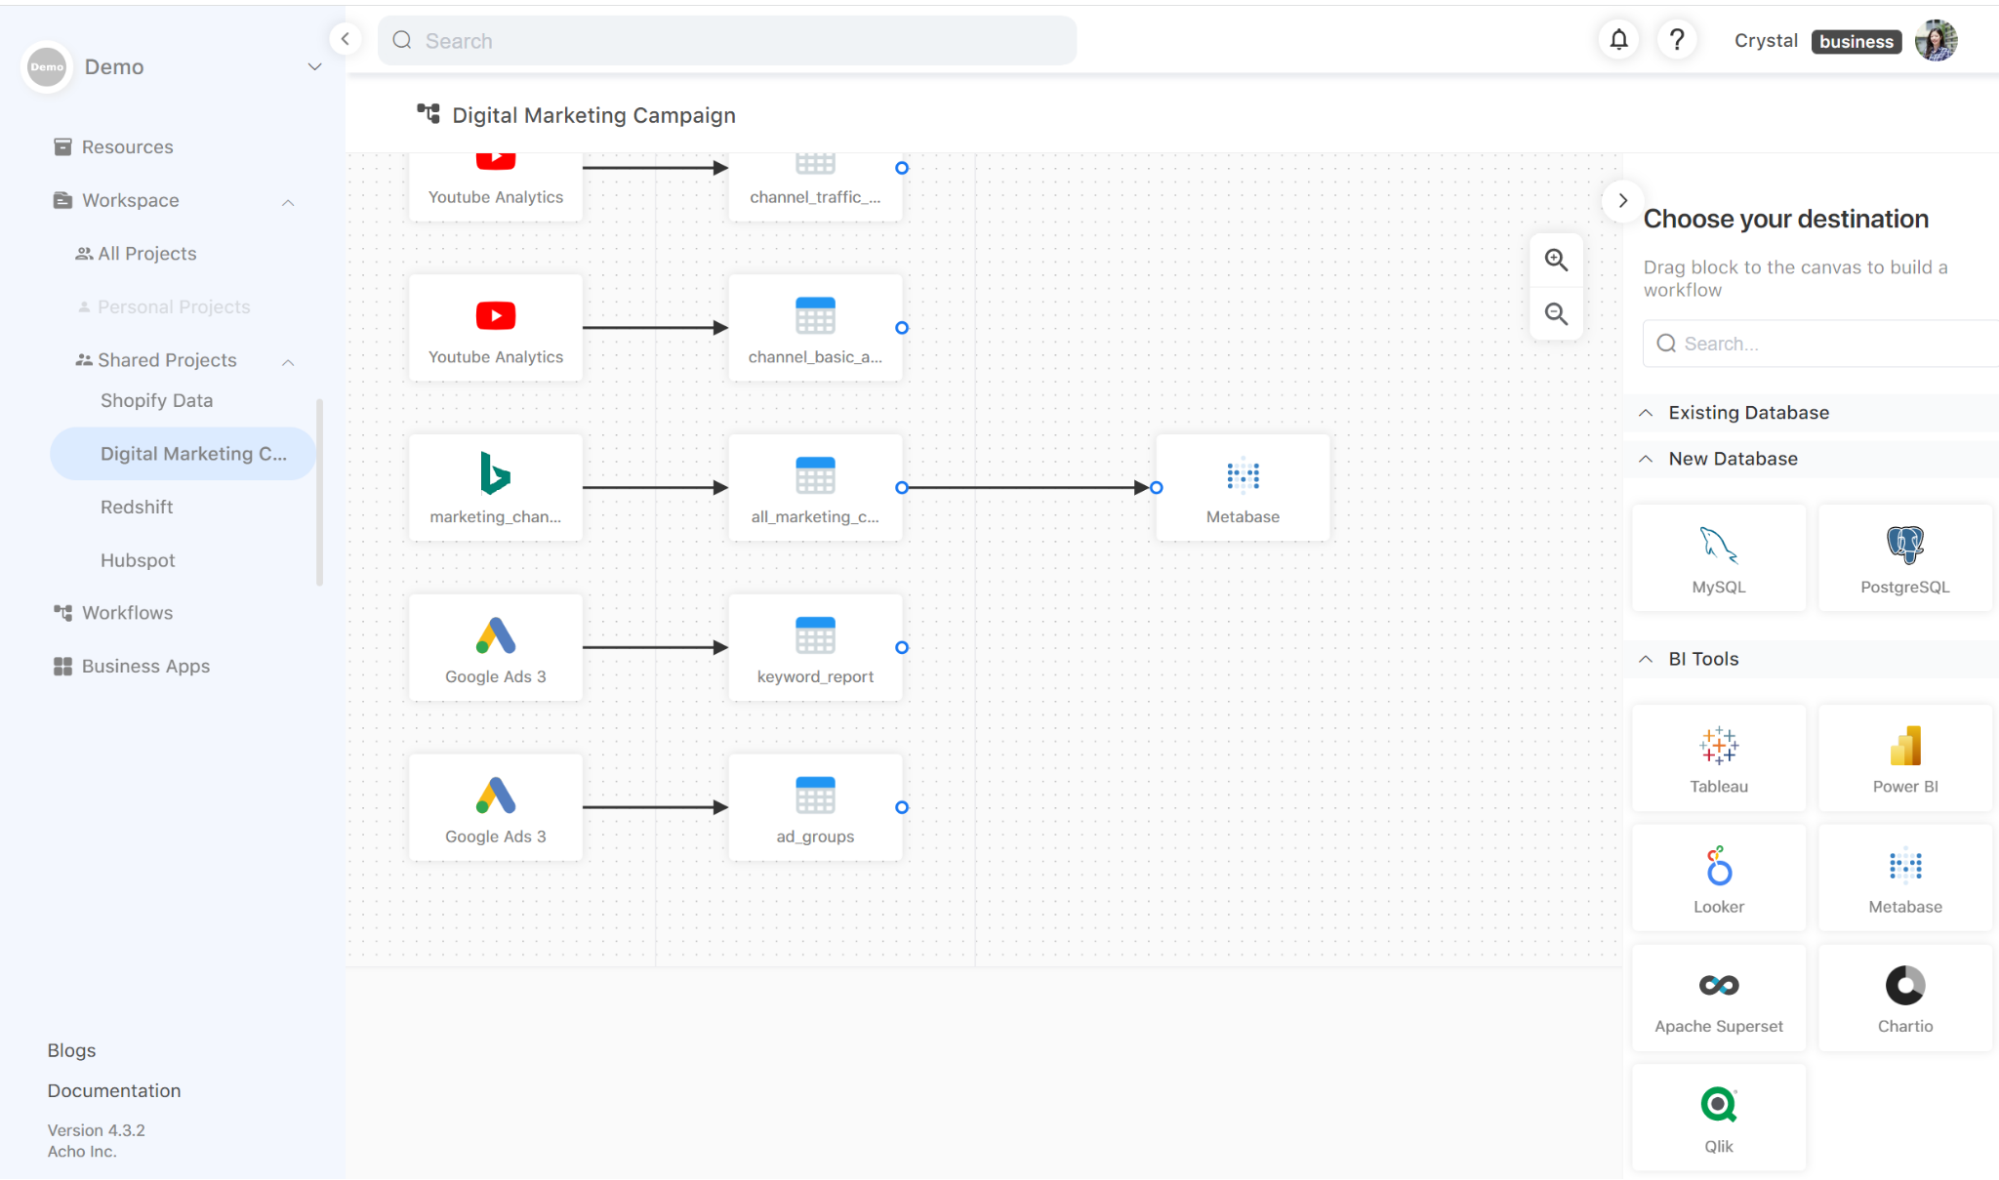
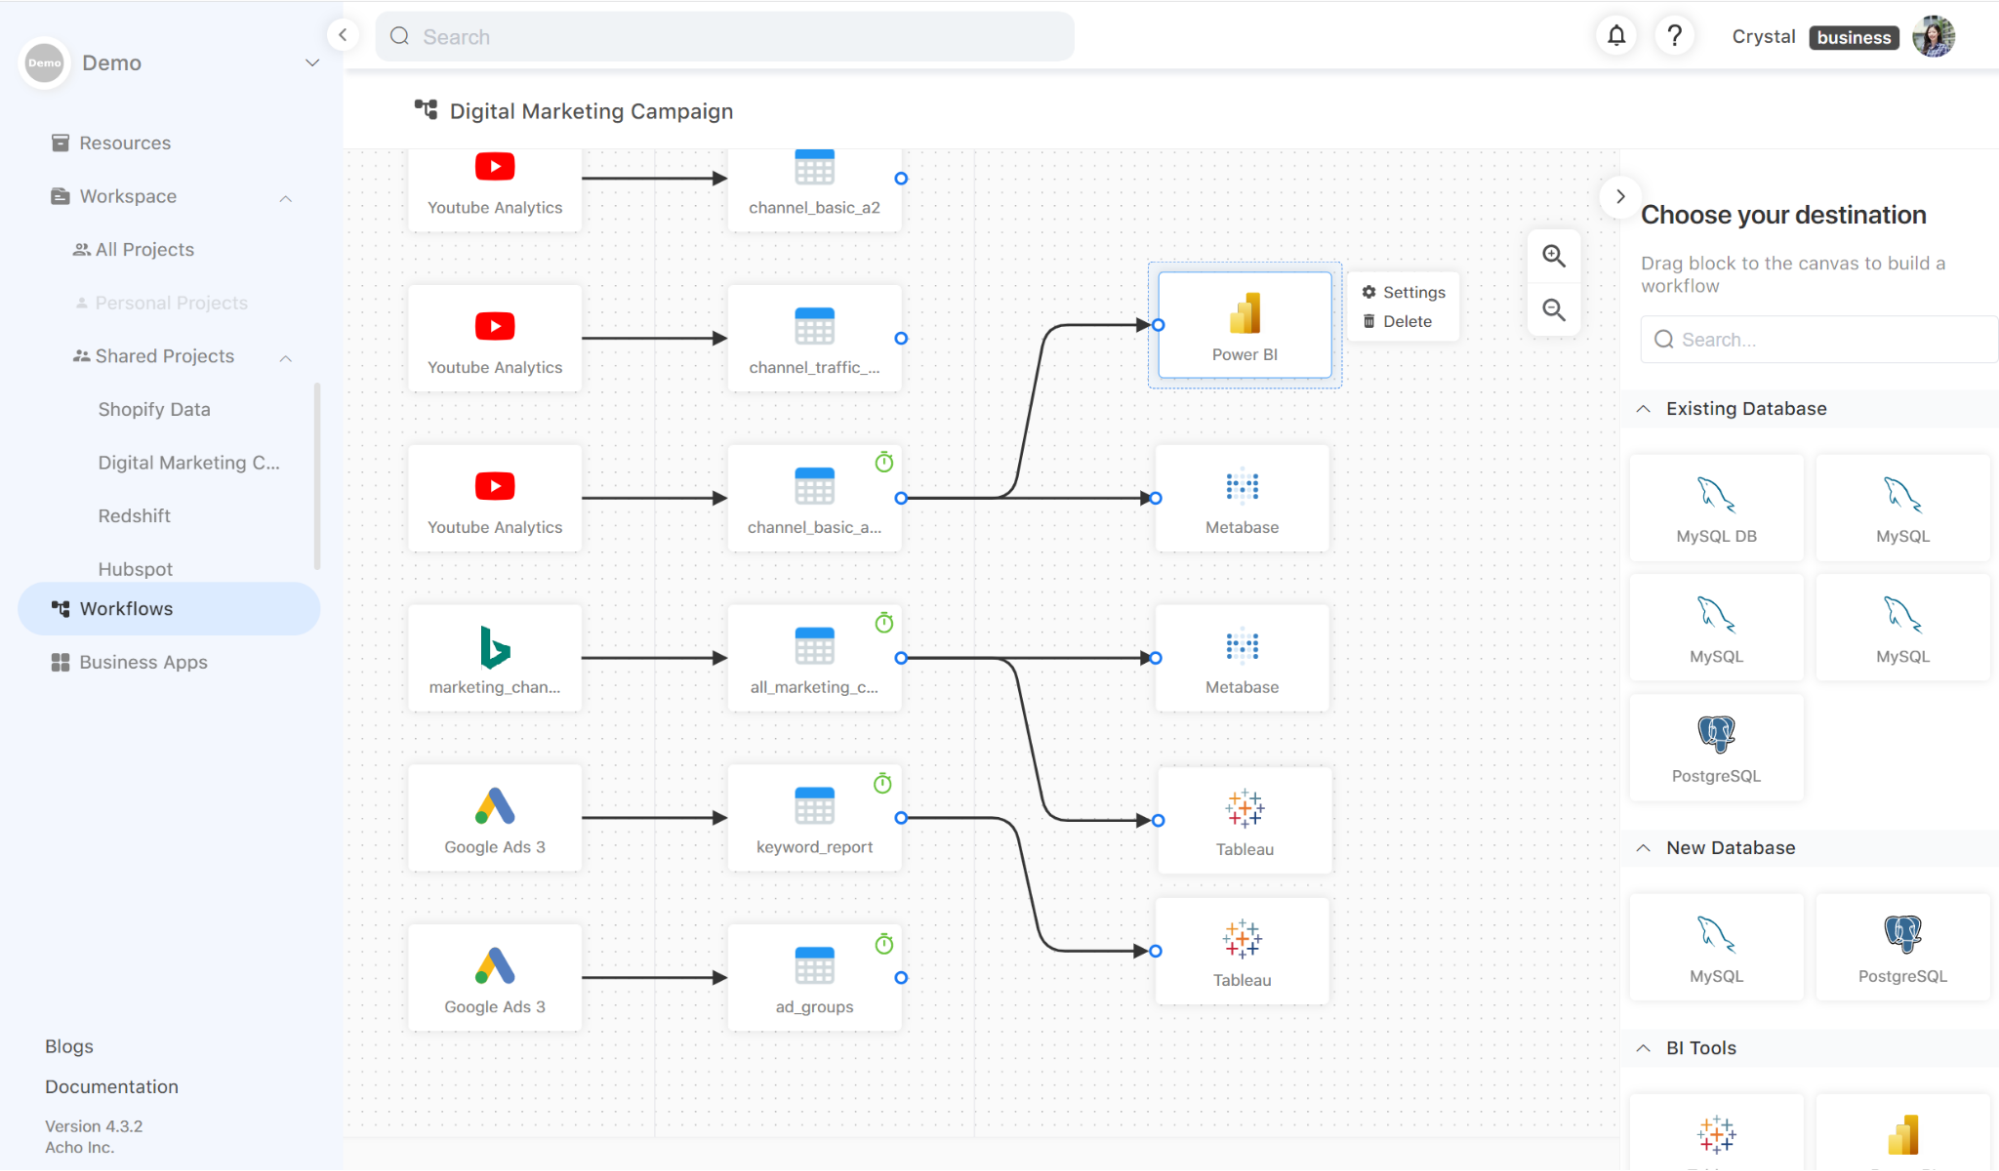
Manage and maintain the pipelines
Once all BI tool connections are set up, all data flows, from data sources to destinations, will be displayed in a data lineage diagram. This diagram allows you to monitor and control all data exports. You can easily schedule data sync, add new destinations, or delete existing destinations.
Hope this article helps. Contact us in the chatbox on the bottom right corner of this page if you have any questions.
- Schedule a Discovery Call
- Chat with Acho: Chat now
- Email us directly: contact@acho.io
Related articles:
>> How to Create a Dashboard From Multiple Source APIs