
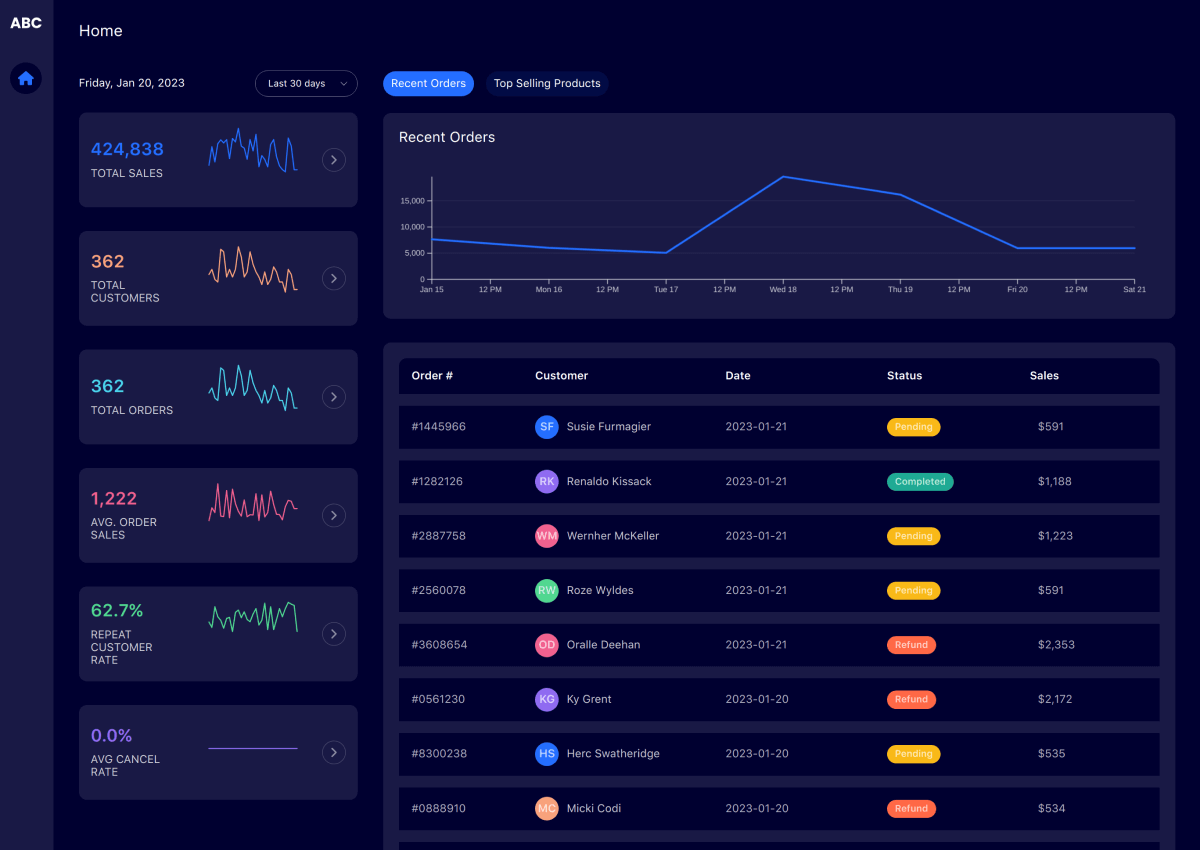
A revenue dashboard helps business view and analyze key metrics related to revenue in one central location. This can include data such as total revenue, revenue by product or service, revenue by customer or market segment, and revenue by time period. The dashboard typically presents this information in an easy-to-read format, such as charts, tables, and graphs, and allows users to drill down into the data for more detailed analysis. The dashboard can be used to track performance over time, identify trends, and make informed decisions about future revenue strategies.
A revenue dashboard helps business view and analyze key metrics related to revenue in one central location. This can include data such as total revenue, revenue by product or service, revenue by customer or market segment, and revenue by time period. The dashboard typically presents this information in an easy-to-read format, such as charts, tables, and graphs, and allows users to drill down into the data for more detailed analysis. The dashboard can be used to track performance over time, identify trends, and make informed decisions about future revenue strategies.