Introduction
API monitoring involves tracking the performance, availability, and usage of APIs to ensure they are functioning as expected. An API monitoring dashboard aggregate and visualize API metrics in an easy and interactive way. It helps developers, DevOps, and other stakeholders keep track of how APIs are performing and detect any issues that may affect the user experience. In this tutorial, we will walk you through the process of building an API monitoring dashboard step by step.

Why do we need to build an API monitoring dashboard?
- Customized Visualization: By building your own API monitoring dashboard, you can design and build interactive visualizations that are tailored to your company’s style and requirement. You can also create custom alerts and notifications based on your team's needs.
- Integration: By creating an API monitoring dashboard, you can smoothly incorporate all of your current APIs in one page, which increases efficiency by providing a unified view of all your APIs' performance, allowing you to identify and resolve issues quickly.
- Easier Sharing with Customers and Coworkers: By providing a clear and accessible dashboard of your API performance, you can demonstrate your commitment to quality and transparency. This can help build trust and foster stronger relationships with your clients and partners. Additionally, a dashboard also increases efficiency as an internal tool since it allows your coworkers to access the necessary information easily.
Step by Step tutorial to build an API monitoring dashboard
Step 1: Create a table in the database to save the record of API attempts
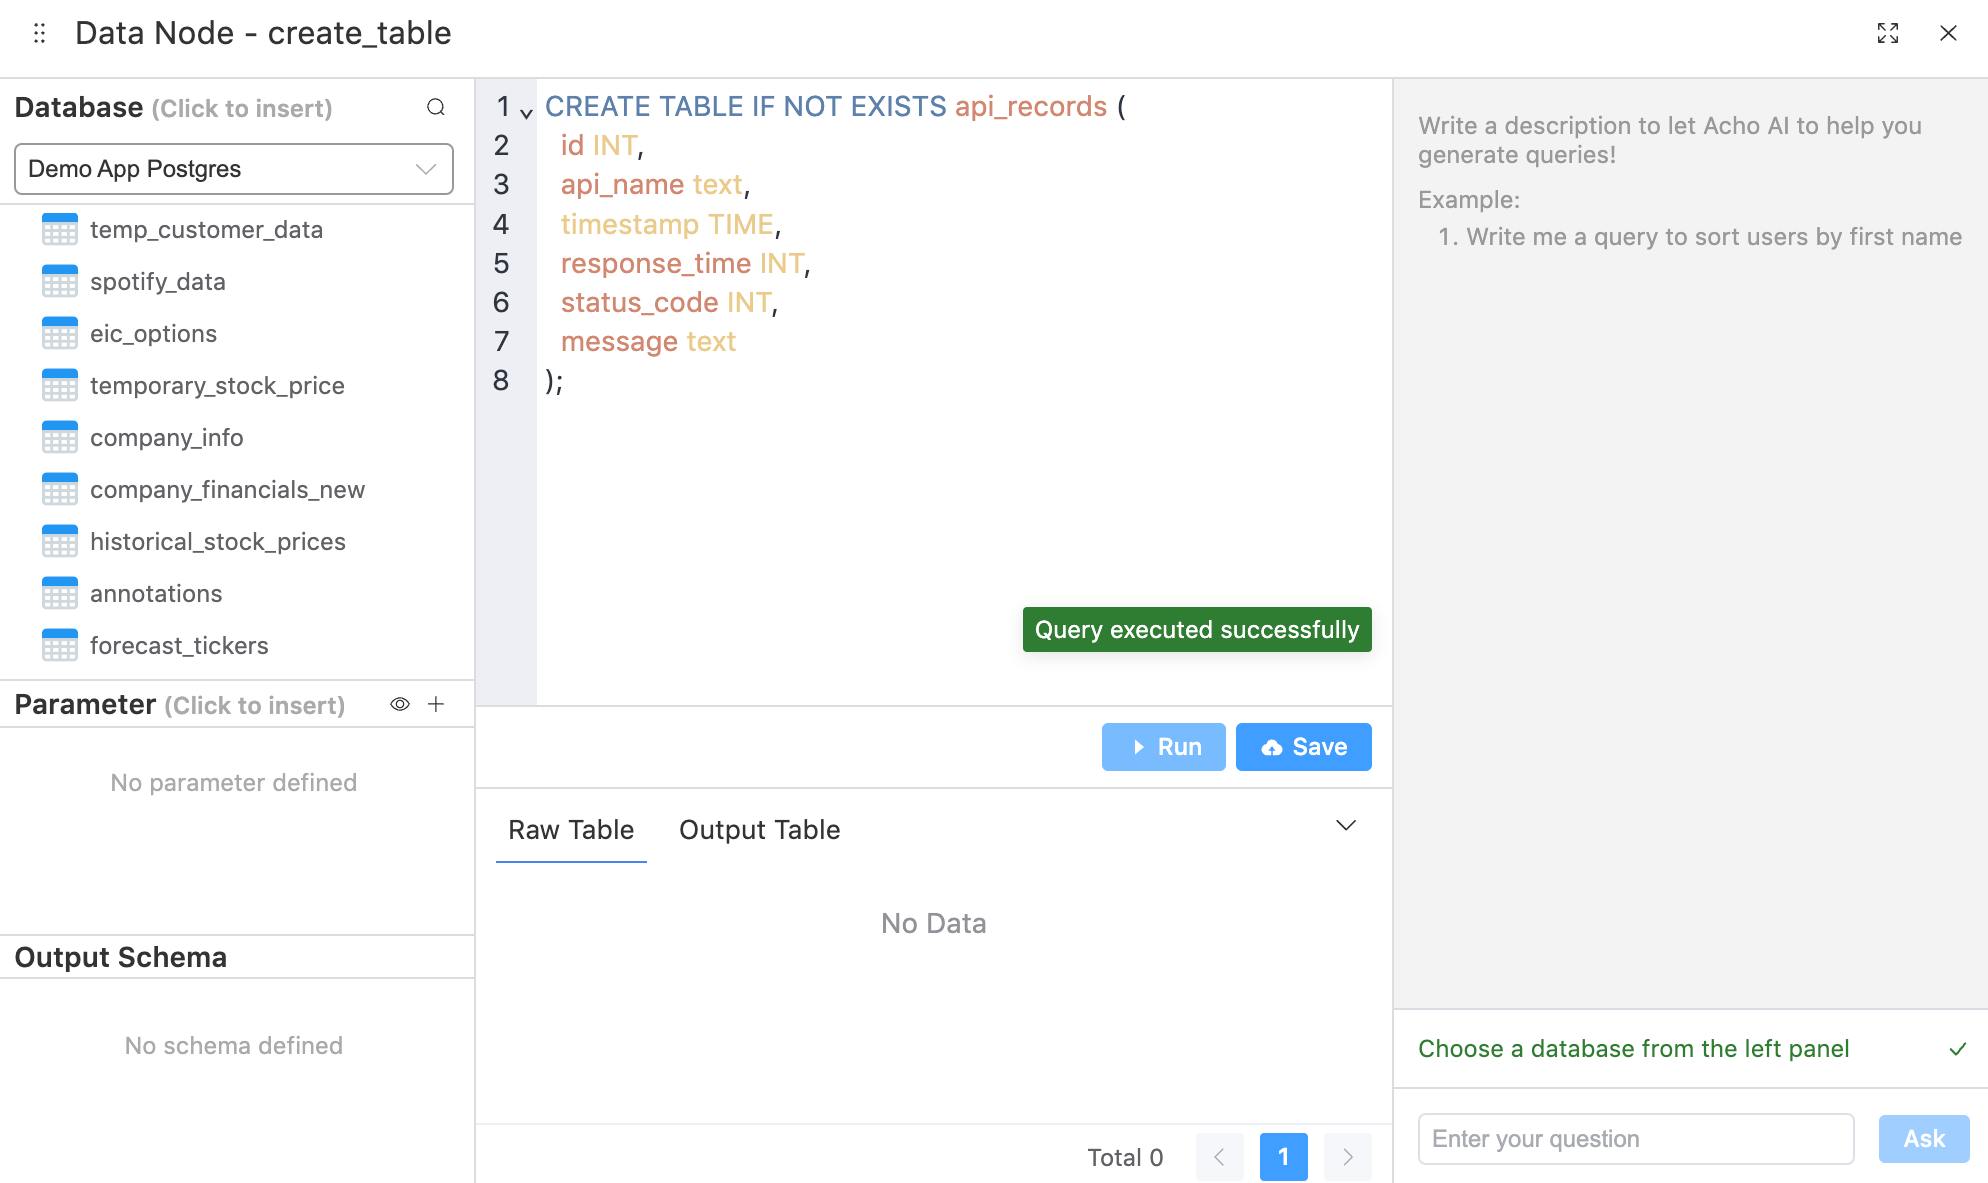
To track the performance of your API, you'll need to store relevant data in a database. Create a table to save the record of API attempts, including the timestamp, response time, status code, messages.
(Example code in our Data node)

Step 2: Deploy a scheduler to trigger API attempts periodically
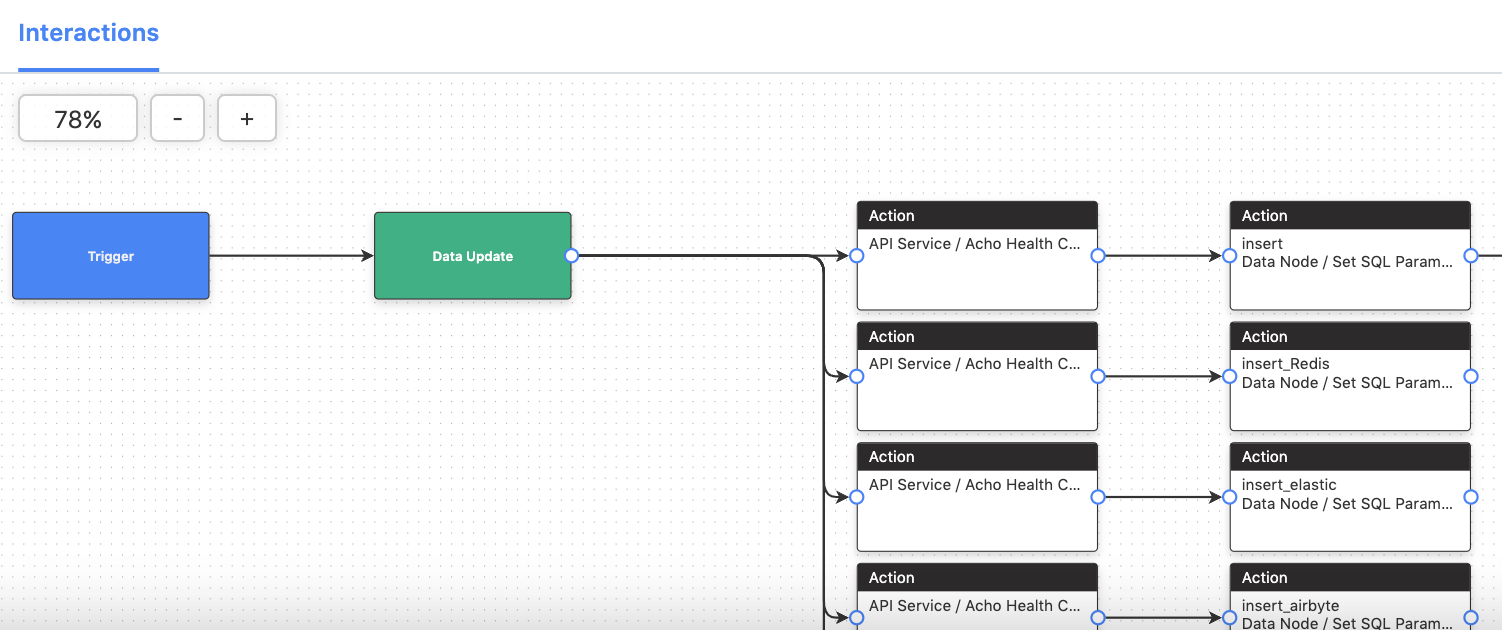
To monitor your APIs, you'll need to make periodic attempts to access your APIs and record the results. Set up a scheduler to trigger these attempts at regular intervals, such as every minute or hour. Then trigger an action to store the attempt results on the database.

Step 3: Design and create visualizations for API monitoring
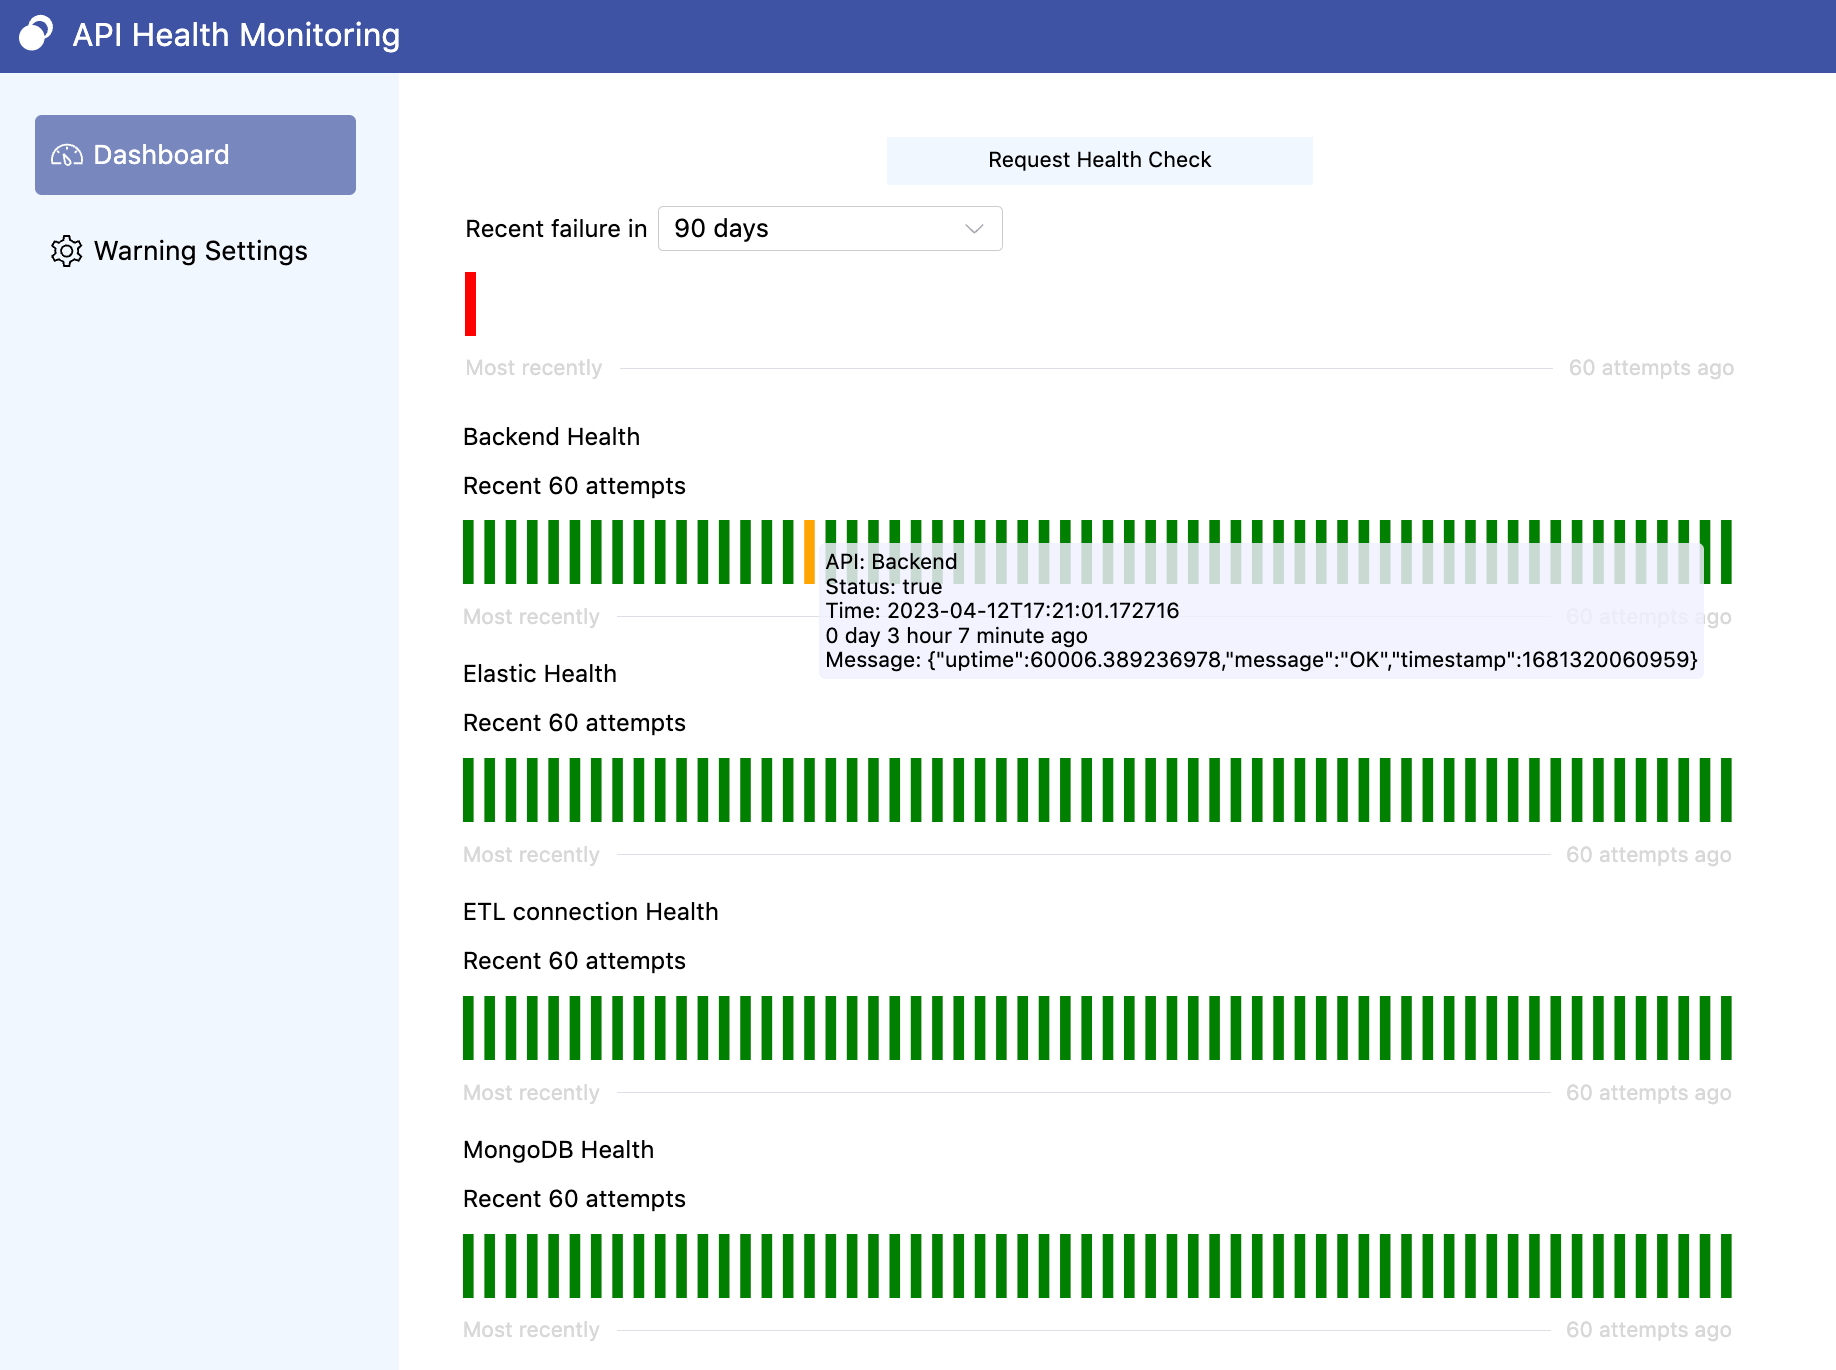
Now that you have the data, it's time to create visualizations that display the performance and usage of your API. You can use the chart element of our app builder to easily create engaging and interactive visualizations that fit your company’s needs. For example, in this demo API monitoring dashboard, users can view detailed logs by simply hovering over each attempt, and configure warnings to be sent via email or Slack messages as needed.
If you’re interested in building your own API monitoring dashboard, don’t hesitate to try! We are happy to help you learn more about it. Contact us in the chat box on the bottom right corner of this page if you have any questions!
- Schedule a Discovery Call
- Chat with Acho: Chat now
- Email us directly: contact@acho.io
>>
How to pull data from an API?
>>
How to Create a Dashboard From Multiple Source APIs?
>>
How to Build a Web Dashboard Without Hosting a Server